Phylogenomic Analysis of Human Genome
The database provides a thorough and robust insight into the evolutionary history of the human genome. The database combines carefully curated phylogenetic histories of human multigene families with synteny analysis, relative dating, and tree topology comparison approaches to comprehend the evolutionary mechanisms that shaped our own genome during its recent (Tetrapod specific) and ancient (prior to fish-tetrapod split) history.

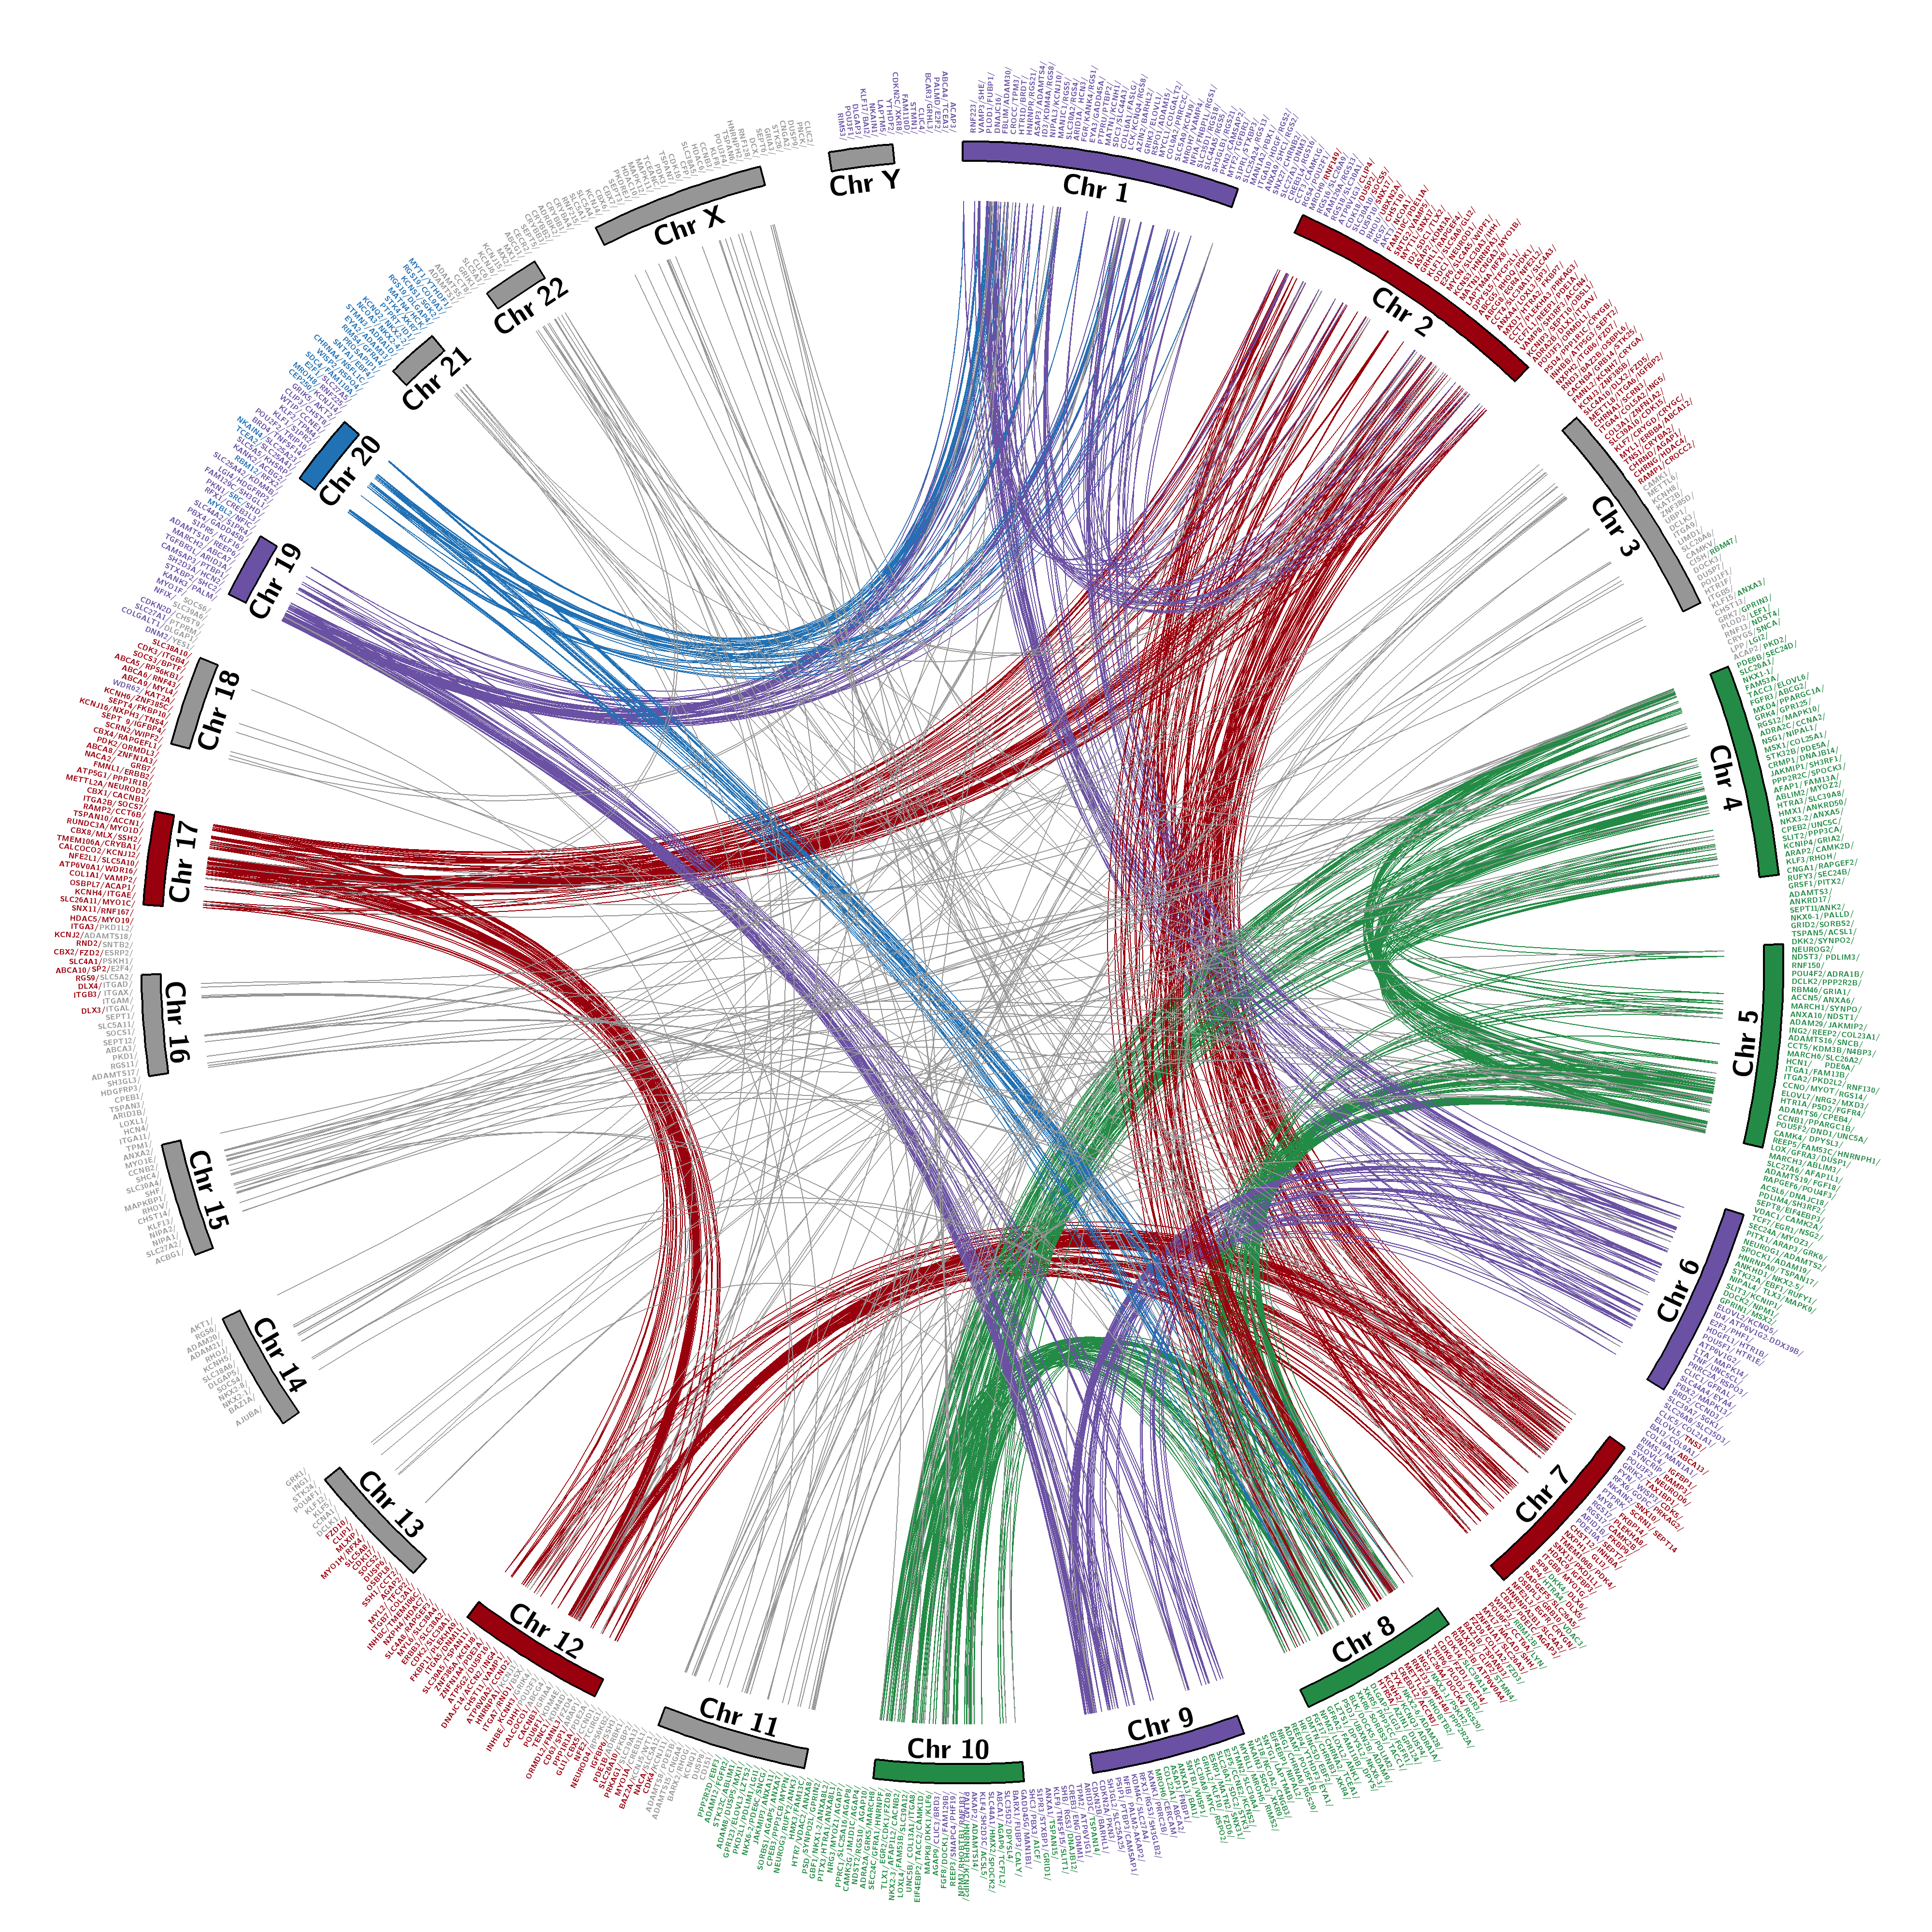
Figure 1: This figure illustrates the actual location of members of all multi-gene families that constitute distinct human paralogon presented in PAHG. Family member names are clickable and would lead to in-depth source data. The figure constitutes all human chromosomes with family members distributed to the entire human karyotype except chromosome 'Y'.
Red color represents Hsa 2/7/12/17, Green color represents Hsa 4/5/8/10, Blue color represents Hsa 1/2/8/20, and purple color represents Hsa 1/6/9/19. *1/*2/*8 chromosomes are repeatedly present among different Paralogon studies. Grey lines connect genes positions on Hsa:3/11/13/14/15/16/18/21/22 and chromosome X.

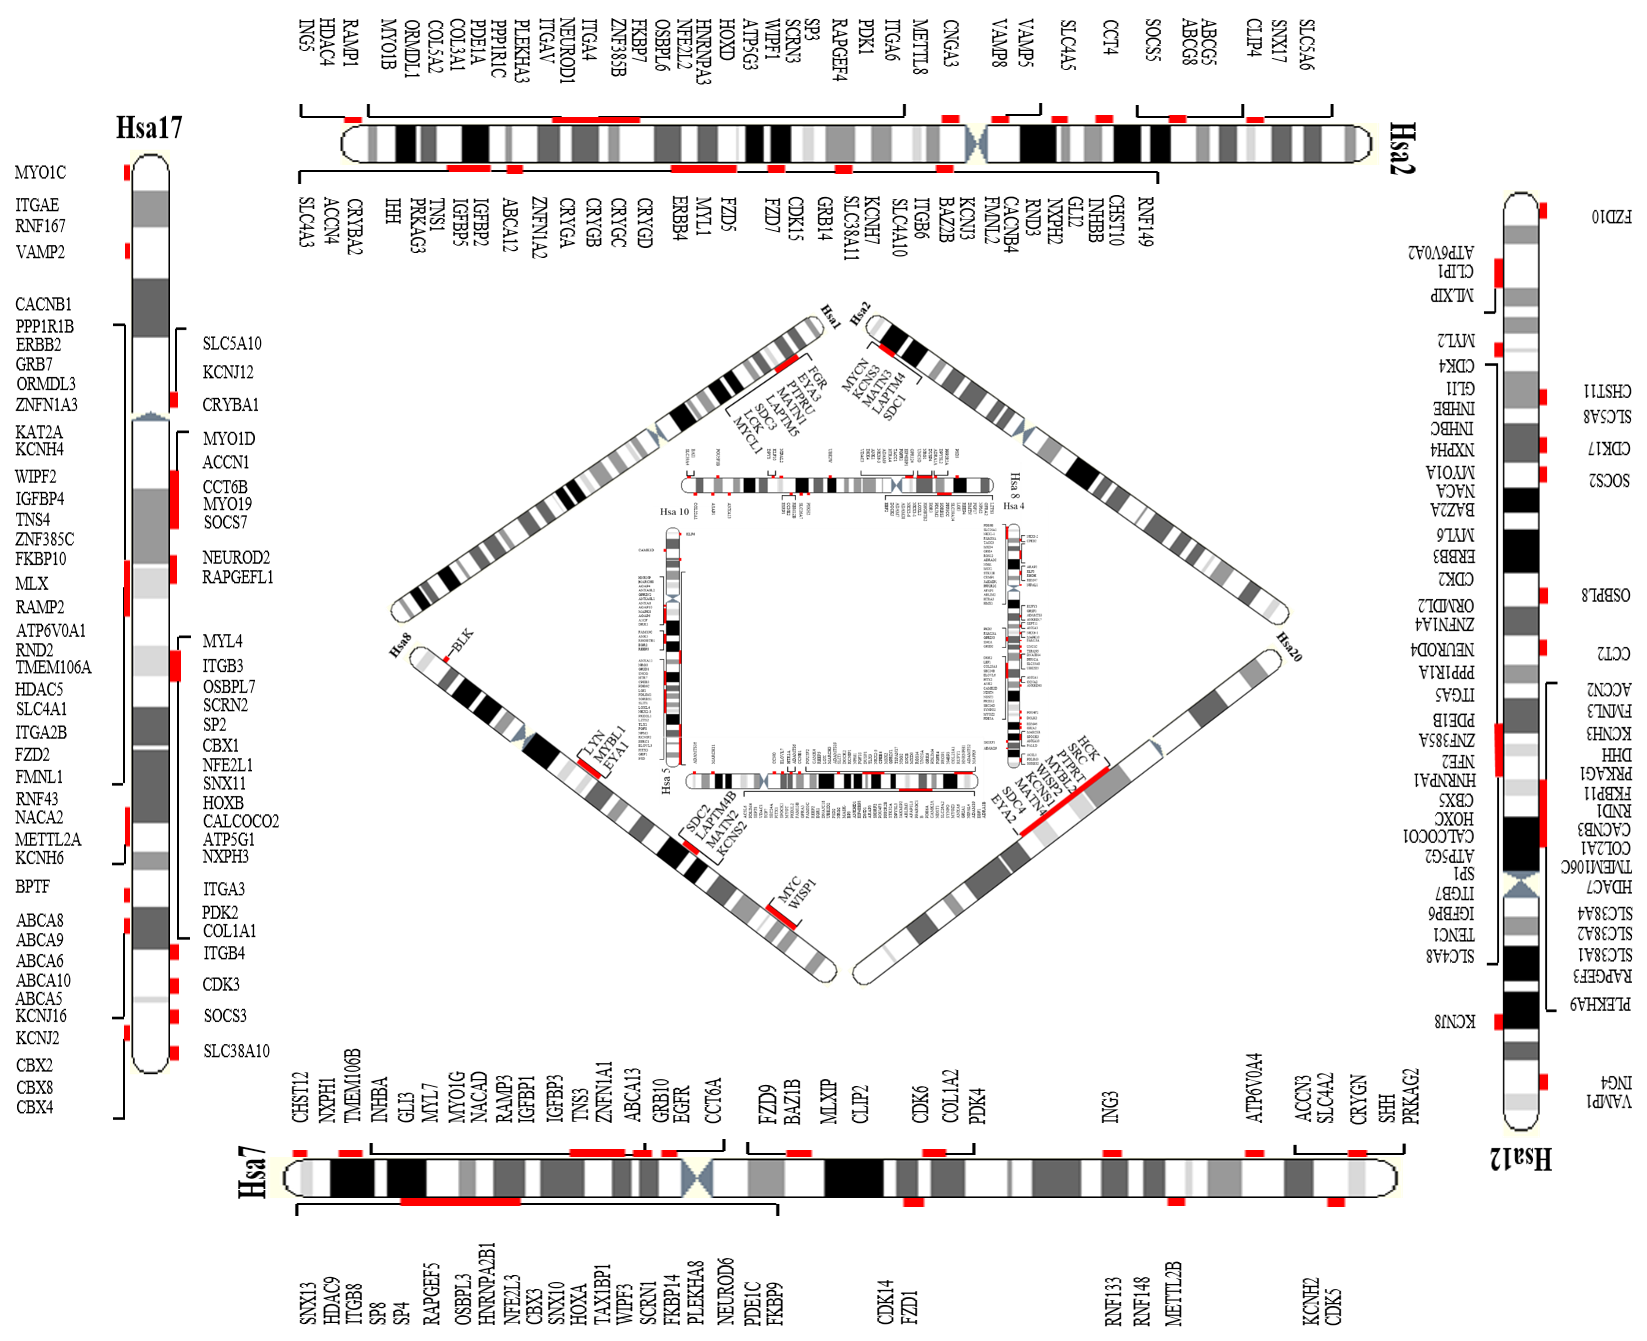
Figure 2: Four of the paralogy blocks in human genome i.e Hsa 2/7/12/17, Hsa 4/5/8/10, Hsa 1/2/8/20, and Hsa 1/6/9/19 are presented in this picture. Triplicated/quadruplicated paralogy regions residing on these human chromosomes are highlighted.