MHC paralogon phylogenomic analysis
Genes from 40 human gene families (in total 175 genes) with threefold or fourfold representations on human MHC bearing chromosomes were incorporated in the analysis. These gene families were identified by scanning the human genome sequence maps available at Ensemble (Cunningham et al., 2015; Hubbard et al., 2002) and UCSC genome browser (Karolchik et al., 2014). Six families showed quadruplicated while the remaining 34 families showed triplicated representation on the MHC paralogon. The closest putative orthologs of the human proteins in other species were identified by using the BLASTP (Altschul et al., 1990) program in the Ensemble genome browser (Cunningham et al., 2015). For those organisms for which sequence information was not present at Ensemble (Cunningham et al., 2015), BLASTP (Altschul et al., 1990) was carried out against the protein database available at the National Center for Biotechnology Information (Johnson et al., 2008) and the Joint Genome Institute (Nordberg et al., 2014). This resulted in the collection of in total 2246 protein sequences.
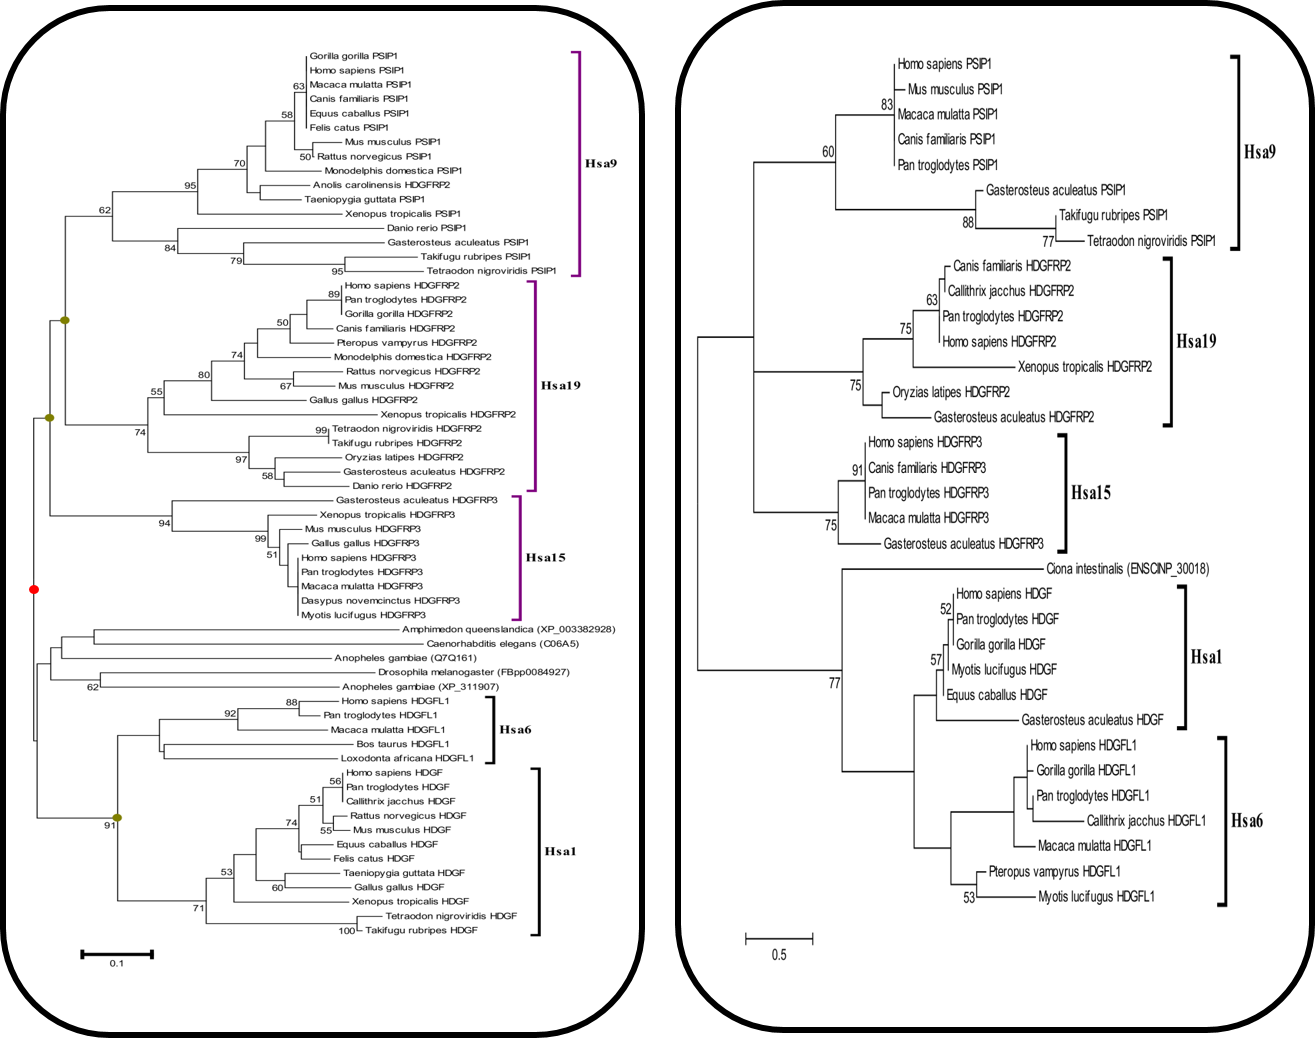
Amino acid sequences were aligned by using CLUSTAL W (Thompson et al., 1994) under default parameters. Phylogenetic trees were constructed using Neighbor-Joining (NJ) method (Saitou and Nei, 1987) with p-distance as amino-acid substitution model, implemented in MEGA version 5 (Tamura et al., 2011). Complete deletion option was selected to eliminate any sites which can introduce a gap in the sequences. The sequences that were too diverged and disrupting the entire tree were excluded from the analysis. The authenticity of the tree topologies were confirmed by bootstrap method (Felsenstein, 1985) with 1000 pseudoreplicates. To systematically check and validate trees with a different reconstruction method, Maximum Likelihood (ML) with Whelan and Goldman (WAG) model (Whelan and Goldman, 2001) was implemented by using MEGA 5 (Tamura et al., 2011). For each gene family, the order of branching within the phylogenetic tree was used to estimate the time window of gene duplication events relative to the divergence of major taxa of organisms.
The species that were selected in the analysis comprised of Homo sapiens (Human), Mus musculus (Mouse), Pan troglodytes (Chimpanzee), Gorilla gorilla (Gorilla), Callithrix jacchus (Marmoset), Pongo abelii (Orangutan), Macaca mulatta (Macaque), Rattus norvegicus (Rat), Oryctolagus cuniculus (Rabbit), Gallus gallus (Chicken), Taeniopygia guttata (Zebra finch), Canis familiaris (Dog), Felis catus (Cat), Bos taurus (Cow), Equus caballus (Horse), Loxodonta Africana (Elephant), Dasypus novemcinctus (Armadillo), Myotis lucifugus (Microbat), Pteropus vampyrus (Megabat), Monodelphis domestica (Opossum), Ornithorhynchus anatinus (Platypus), Anolis carolinensis (Lizard), Pelodiscus sinensis (Chinese softshell turtle), Xenopus tropicalis (Frog), Erinaceus europaeus (Hedgehog), Danio rerio (Zebrafish), Takifugu rubripes (Fugu), Tetraodon nigroviridis (Tetraodon), Gasterosteus aculeatus (Stickleback), Oryzias latipes (Medaka), Ciona intestinalis (Ascidian), Ciona savignyi (Ascidian), Branchiostoma floridae (Amphioxus), Strongylocentrotus purpuratus (Sea urchin), Drosophila melanogaster (Fruit fly), Apis mellifera (Honey bee), Anopheles gambiae (Mosquito), Caenorhabditis elegans (Nematode), Nematostella vectensis (Sea anemone), and Hydra magnipapillata (Hydra), Amphimedon queenslandica (Sponge).

Figure 1(a): Neighbor Joining (N.J) Tree of MHC Family Figure 1(b): Maximum Likelihood (M.L) Tree of MHC Family
Useful references: