HOX paralogon Co-duplicated groups
Tree topology comparison approach employed on 62 gene families indicated harmony among the branching pattern of phylogenetic trees of many distinct gene families. The conservation of physical linkage on human paralogy groups might indicate their parallel origin, thus specifying the similar co-duplicated group (Ambreen et al., 2014). Whereas gene families showing dissimilar tree topology indicate that they might not have duplicated at the same time and do not share their evolutionary history (Abbasi 2010b; Abbasi and Grzeschik 2007; Abbasi and Hanif 2012; Asrar et al., 2013; Hughes and Friedman 2003). Based on these assumptions, 62 families analyzed were partitioned into four co-duplicated groups. Families within a particular co-duplicated group share their evolutionary history and thus might have duplicated simultaneously at the root of vertebrate history by co-duplication/segmental duplication event (Abbasi 2010b). Duplication history summary of families residing on HOX paralogon with respect to speciation events and identified co-duplication events are given in the following table.
| Chromosomes/Paralogon | |||||||
| Name of Co-duplicated group | Co-duplicated Group A | Co-duplicated Group B | Co-duplicated Group C | Co-duplicated Group D | Remaining Families | Largely duplicated in invertebrates (prior to vertebrate invertebrate split) | Total |
| No. of gene families | 12 | 6 | 4 | 9 | 24 | 8 | 62 |
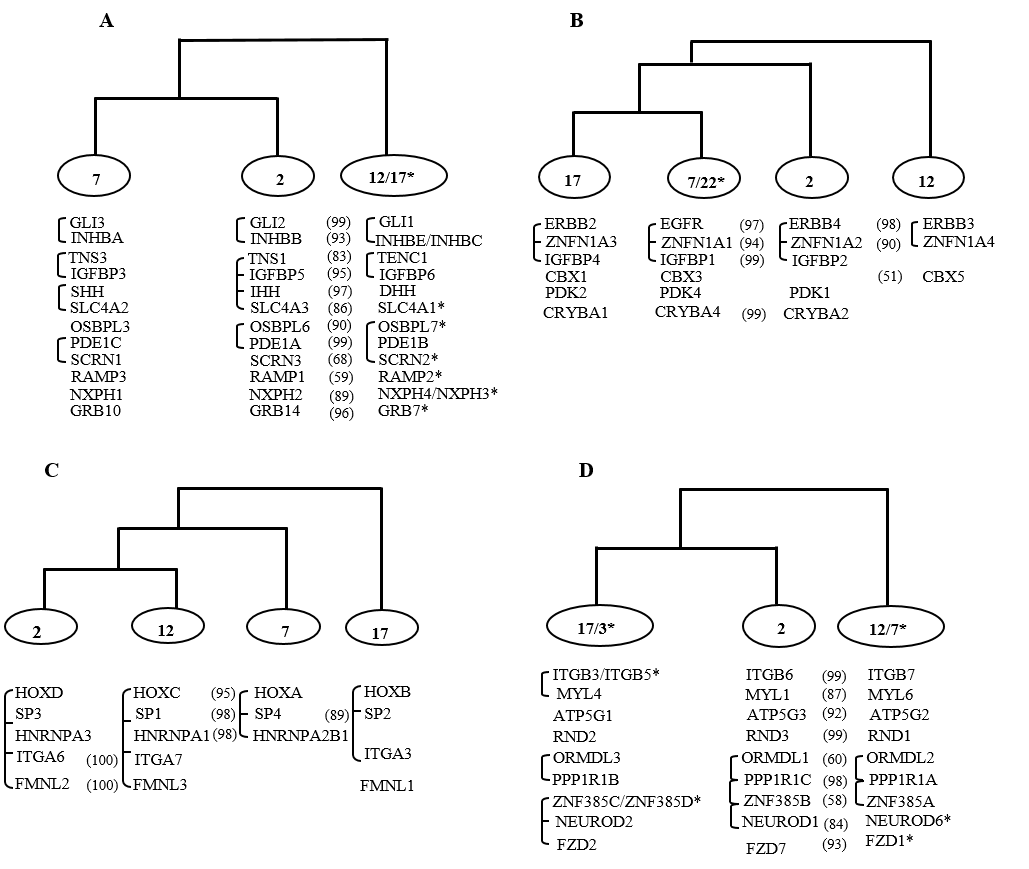
The 1st co-duplicated group: presented a topology of the type ((Hsa7 Hsa2) Hsa12/Hsa17) was the largest and suggests the simultaneous duplication of 12 gene families (Figure 1-A); 2nd co-duplicated group included members from 6 gene families with the topology of type (((Hsa17 Hsa7/Hsa22) Hsa2) Hsa12)(Figure 1-B); 3rd co-duplicated group included HOX-clusters and members from 4 gene families with the topology of the type (((Hsa2 Hsa12) Hsa7) Hsa17)(Figure 1-C); and 4th co-duplicated group: showed the topology of the type ((Hsa17/3 Hsa2) Hsa12/ Hsa7) and involved the members from 9 gene families (Figure 1-D)(Ambreen et al. 2014).

Figure 1: Schematic topologies indicating consistencies in phylogenies of gene families including members on at least three of the human 2, 7, 12, 17 chromosomes. In each case the percentage bootstrap support is given in parentheses and only values ≥50% are presented here. The connecting bars on the left depict the close physical linkage. * Represents situation where a gene family member is not residing on HOX bearing chromosomes. HOX-cluster topology (((HOXD HOXC) HOXA) HOXB) is obtained from previous data published by J. Zhang et al (doi: 10.1093/genetics/142.1.295).
Useful references: