PAHG USER TUTORIAL
Introduction
The PAHG database is designed to be used mainly, but not exclusively, by Evolutionary Biologists, Geneticists, Biochemists, Biotechnologists, Bioinformaticians and researchers from versatile biological communities to obtain evolutionary histories of human paralogy blocks such as Hsa 4/5/8/10 (FGFR bearing Paralogon), Hsa 1/2/8/20, Hsa 2/7/12/17 (HOX cluster bearing paralogon) and Hsa 1/6/9/19 (MHC bearing Paralogon) in an interactive graphical manner. This tutorial gives a short overview on the features available in the database.
- Homepage
- Global Genome-Wide view
- About
- Browse
- Duplication Mechanisms (Theories)
- Human Paralogy Blocks
- Duplication Statistics
- Search
- Member Details
- Family Details
- Download
- Useful Links
- Additional Information
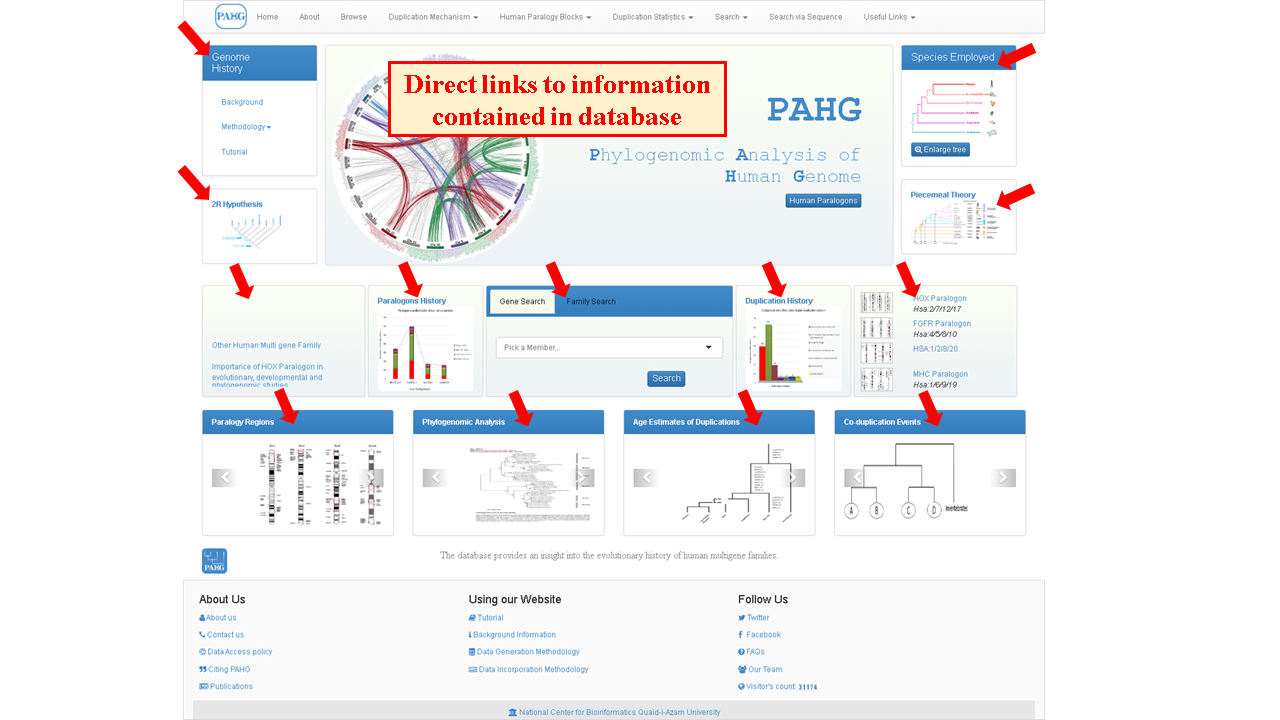
PAHG is interactive, user friendly and novel model for comparative browsing of human paralogy blocks. Homepage is highly compact and throws a light to navigate the information present in a database. The versatile features of the database were embedded in seven tabs of the Menubar. The Jumbotron showcases main contents of webpage and is surrounded by two panels. The vertebrate History panel facilitates the user about Background, Methodology (Data Generation, Data Incorporation) and user guide of database. The Species Employed panel exhibits the information about species employed in phylogenomic analysis. The four sliders present below the jumbotron direct the user to the blogs containing general information about the Synteny, Co-duplicated groups, Relative dating and Phylogenetic Analysis of gene families. The footer section provides the link to social networks, contact page and the FAQs page.
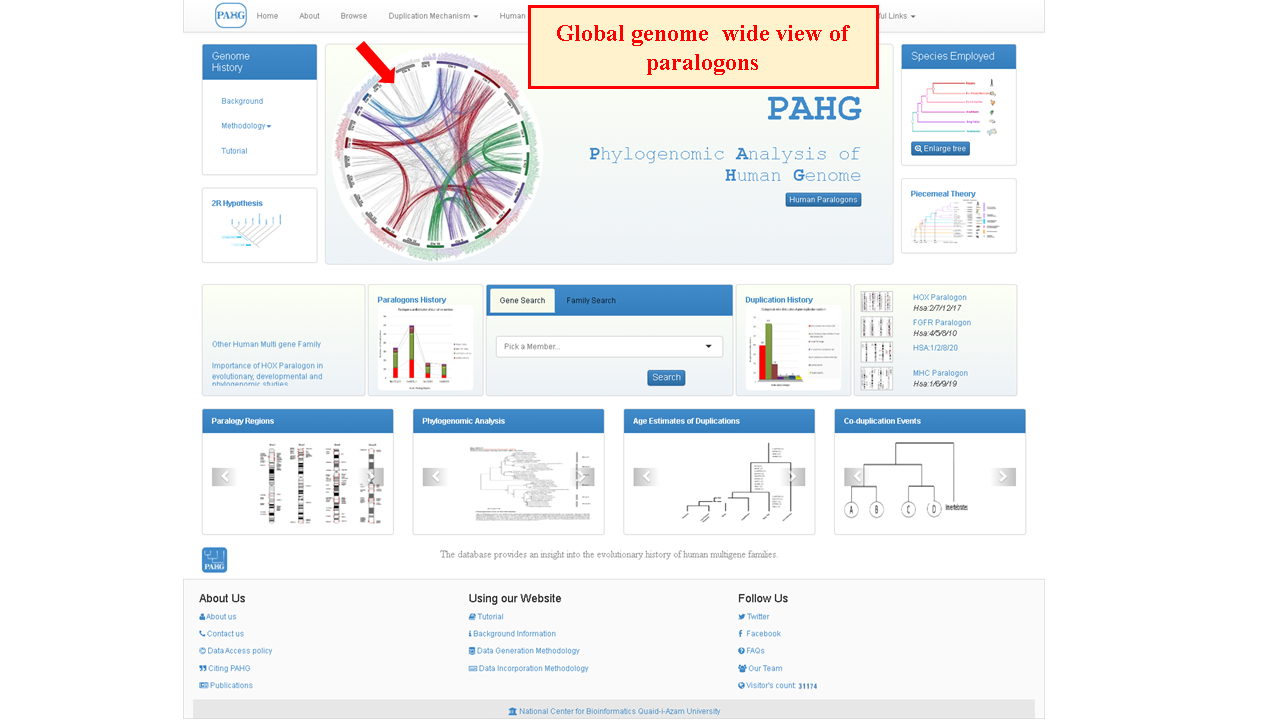
Inside jumbotron, a circos based spinning discoidal one-click responsive genome-wide illustration is shown to briefly depict examined multigene family members. Clicking the illustration leads to zoomed-in view.
Focused view of circos plot illustrates the actual location of members of all multi-gene families that constitute distinct human paralogon presented in PAHG. The figure constitutes all human chromosomes with family members distributed to the entire human karyotype except chromosome 'Y'. Red color represents Hsa 2/7/12/17, Green color represents Hsa 4/5/8/10, Blue color represents Hsa 1/2/8/20, and purple color represents Hsa 1/6/9/19. *1/*2/*8 chromosomes are repeatedly present among different Paralogon studies. Grey lines connect gene positions on Hsa:3/11/13/14/15/16/18/21/22 and chromosome X.
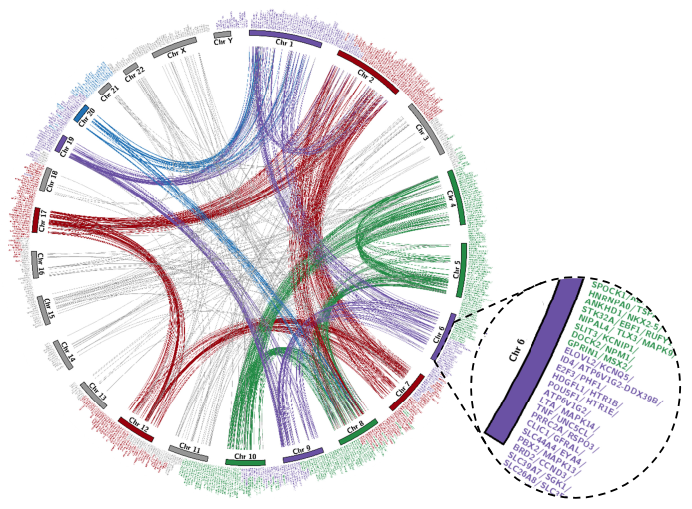
Family member names are clickable and would lead to in-depth source data.
The "About" tab carries the information about the database (PAHG) and the prospects that would be achieved in the near future.
Information extraction can be done by clicking the "Browse" from top menu. The browse tab holds the basic information about the gene families of the four paralogons. It directs the user to the comprehensive table containing summary of all families present in database.
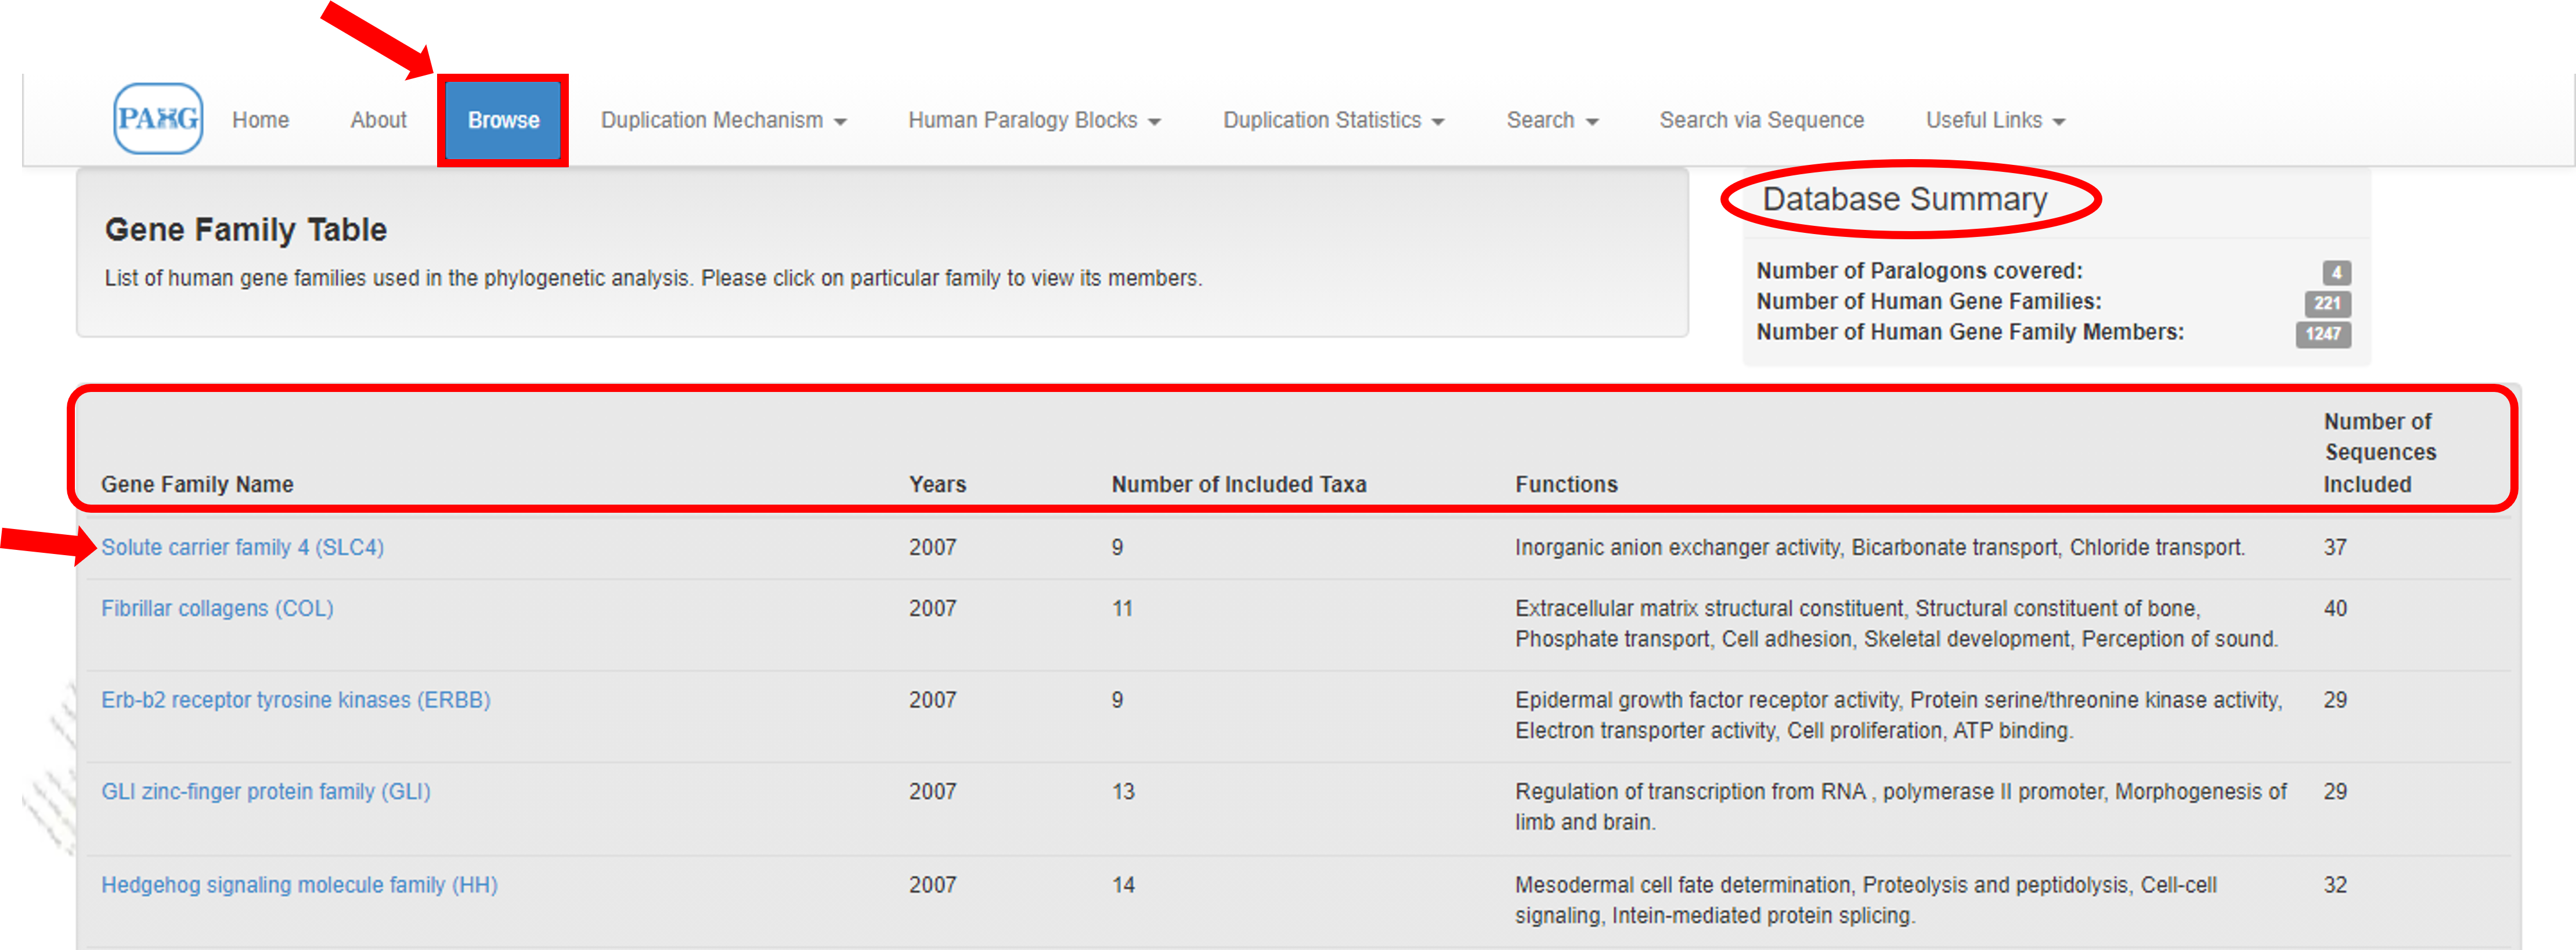
Clicking the family name would navigate the user to member details of it. It includes the names of all members along with their chromosomal locations and protein accession numbers.
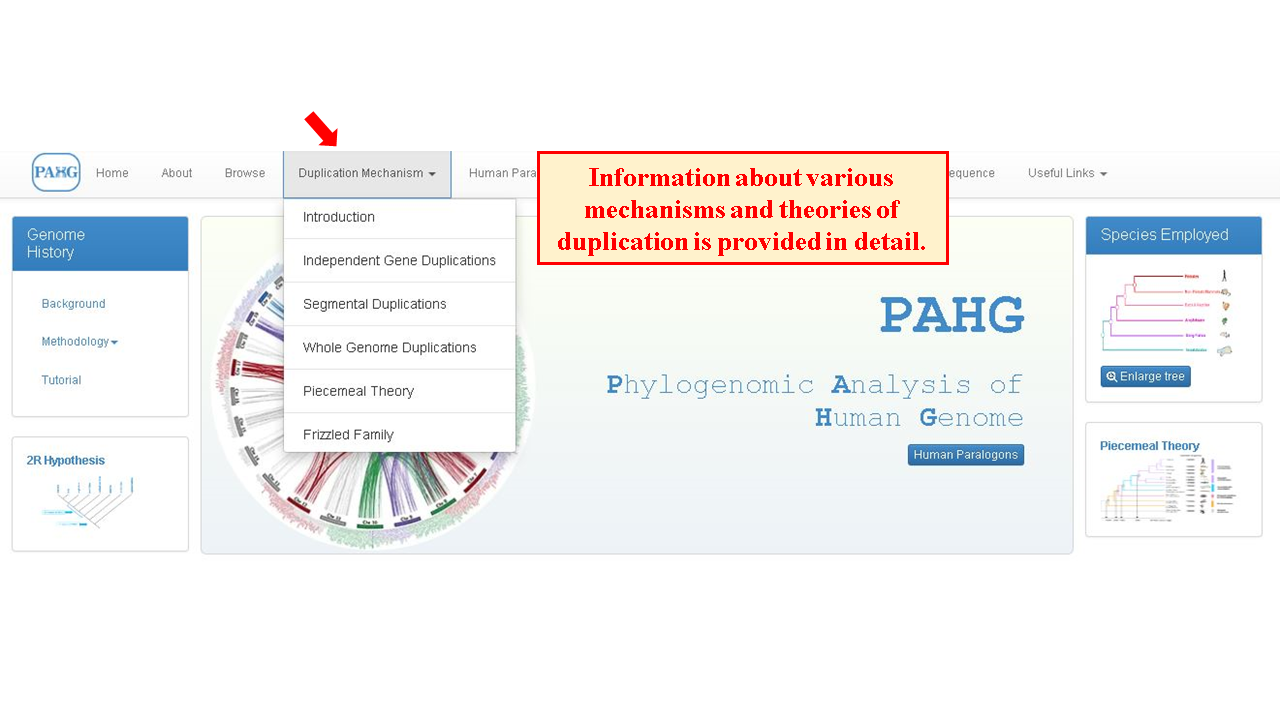
Duplication mechanism tab directs the user to various theories proposed to explain the mechanism of evolution of paralogons in the human genome. These theories are explained for the ease of user to understand the information presented in the database.
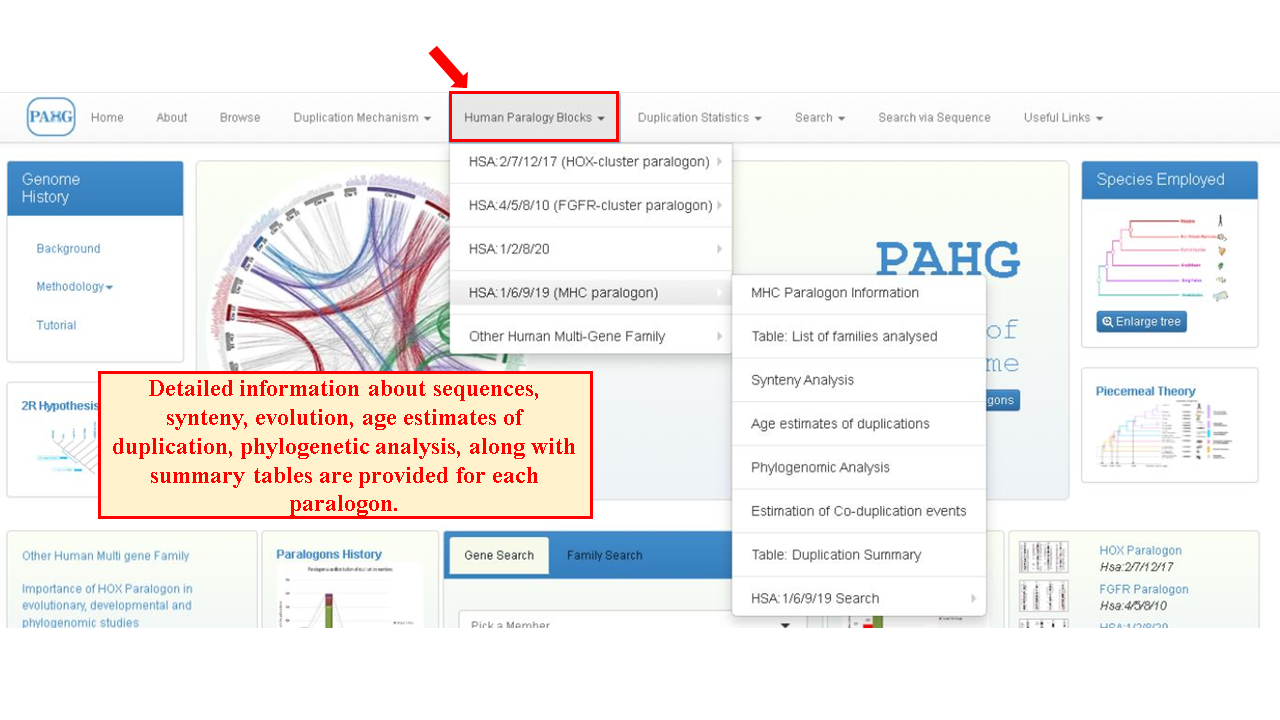
The complete data of the multigene families which reside on these paralogy blocks is centralized in the form of Human Paralogy Blocks. Four famously known human paralogy blocks i.e. HOX cluster paralogon (Hsa 2/7/12/17), FGFR cluster paralogon (Hsa 4/5/8/10), MHC cluster paralogon (Hsa 1/6/9/19) and Hsa 1/2/8/20 are thoroughly investigated and presented in this database. All information regarding these paralogons with the synteny of triplicated/quadruplicated human gene families residing on these paralogons can be accessed by navigating through the sub-menu provided. Age estimates of duplication, co-duplication mechanism of gene families, phylogenomic histories and sequence data of these families can be retrieved.
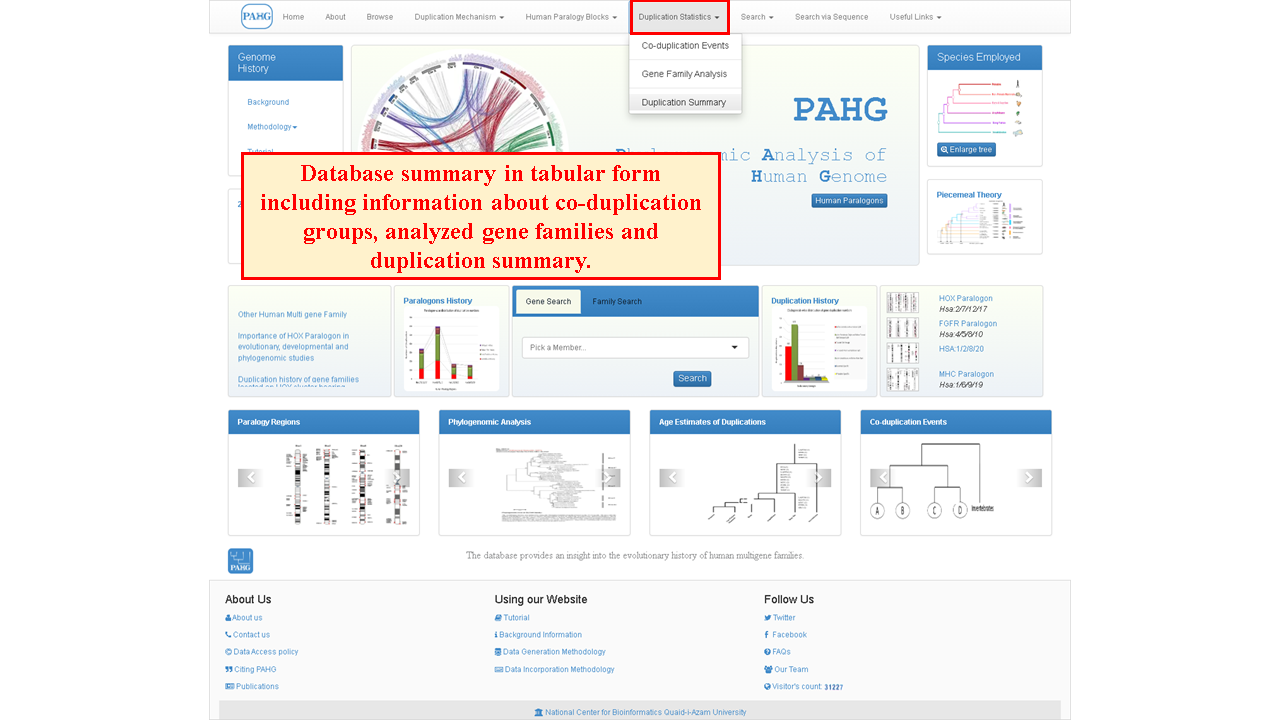
Duplication Statistics tab can be used to visualize information in table form such as co-duplication events, gene family analysis and duplication summary of four human paralogons. Chromosomes involved in co-duplicated groups, number of gene families used in phylogenomic analysis and number of duplications in each paralogon according to relative timing is also mentioned in row and column format. These tables further leads to detailed pages of each paralogon data.
Search option can be used to search for the families included in these paralogons and to access the member data of these families. Going to this option will lead you to search page.
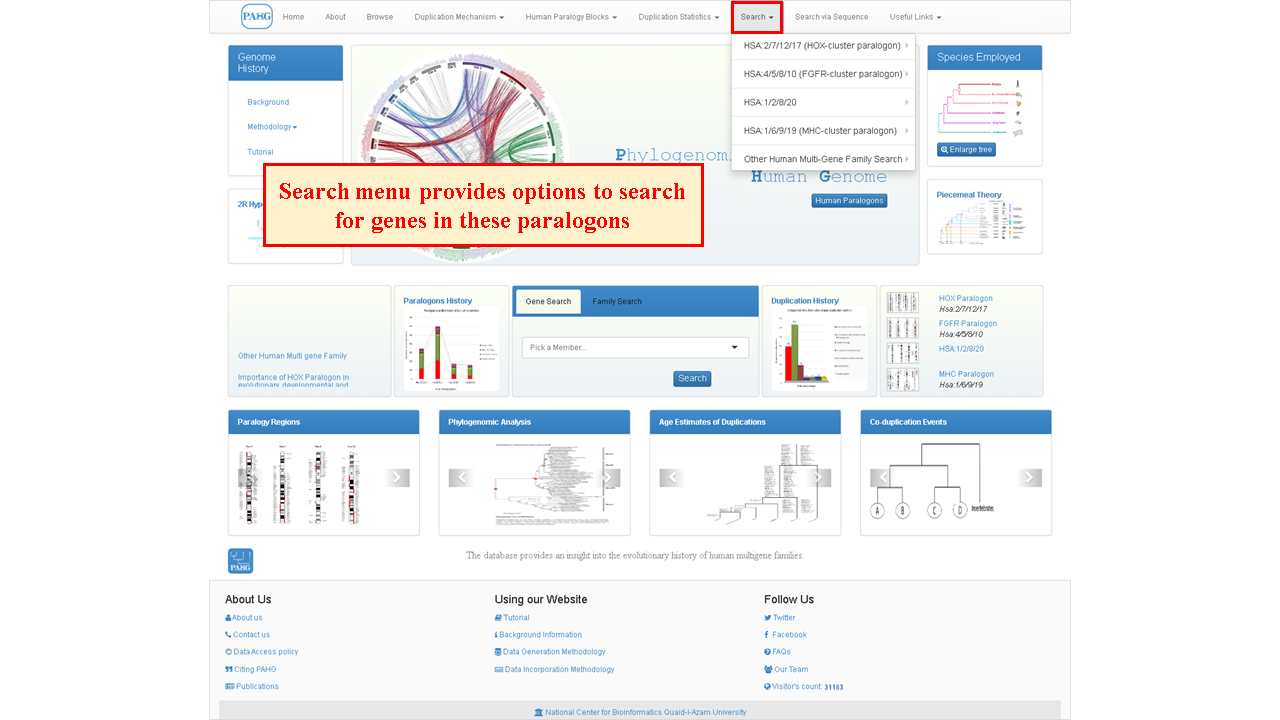
The search tab is placed in the navbar and it allows the user to search for an entire family or any specified member of a particular family by using different options of searching, this is the core component of the database.
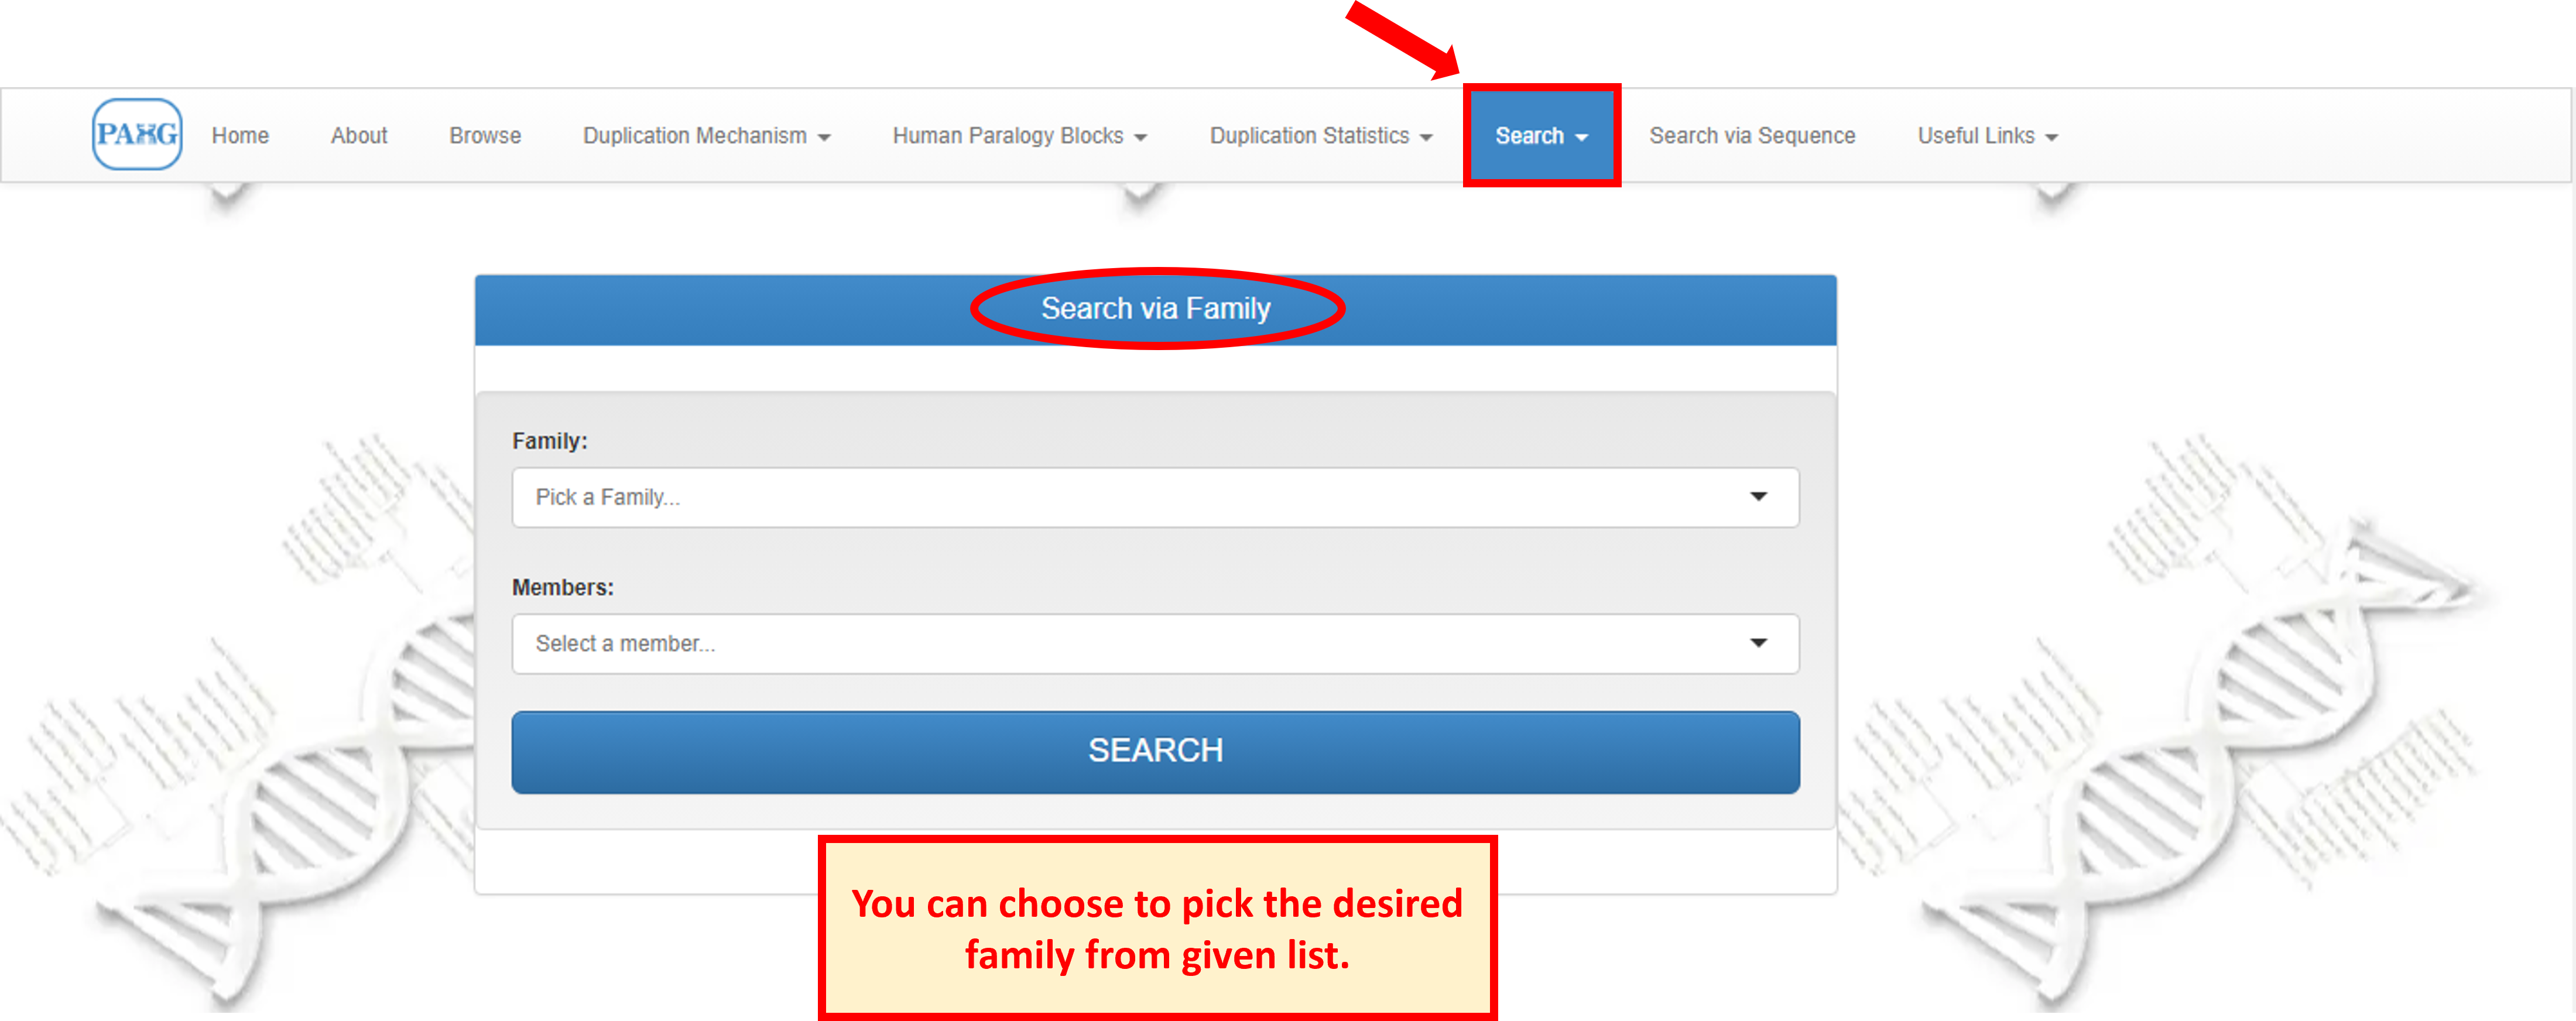
Search page shows the options to search either via family or via sequence.
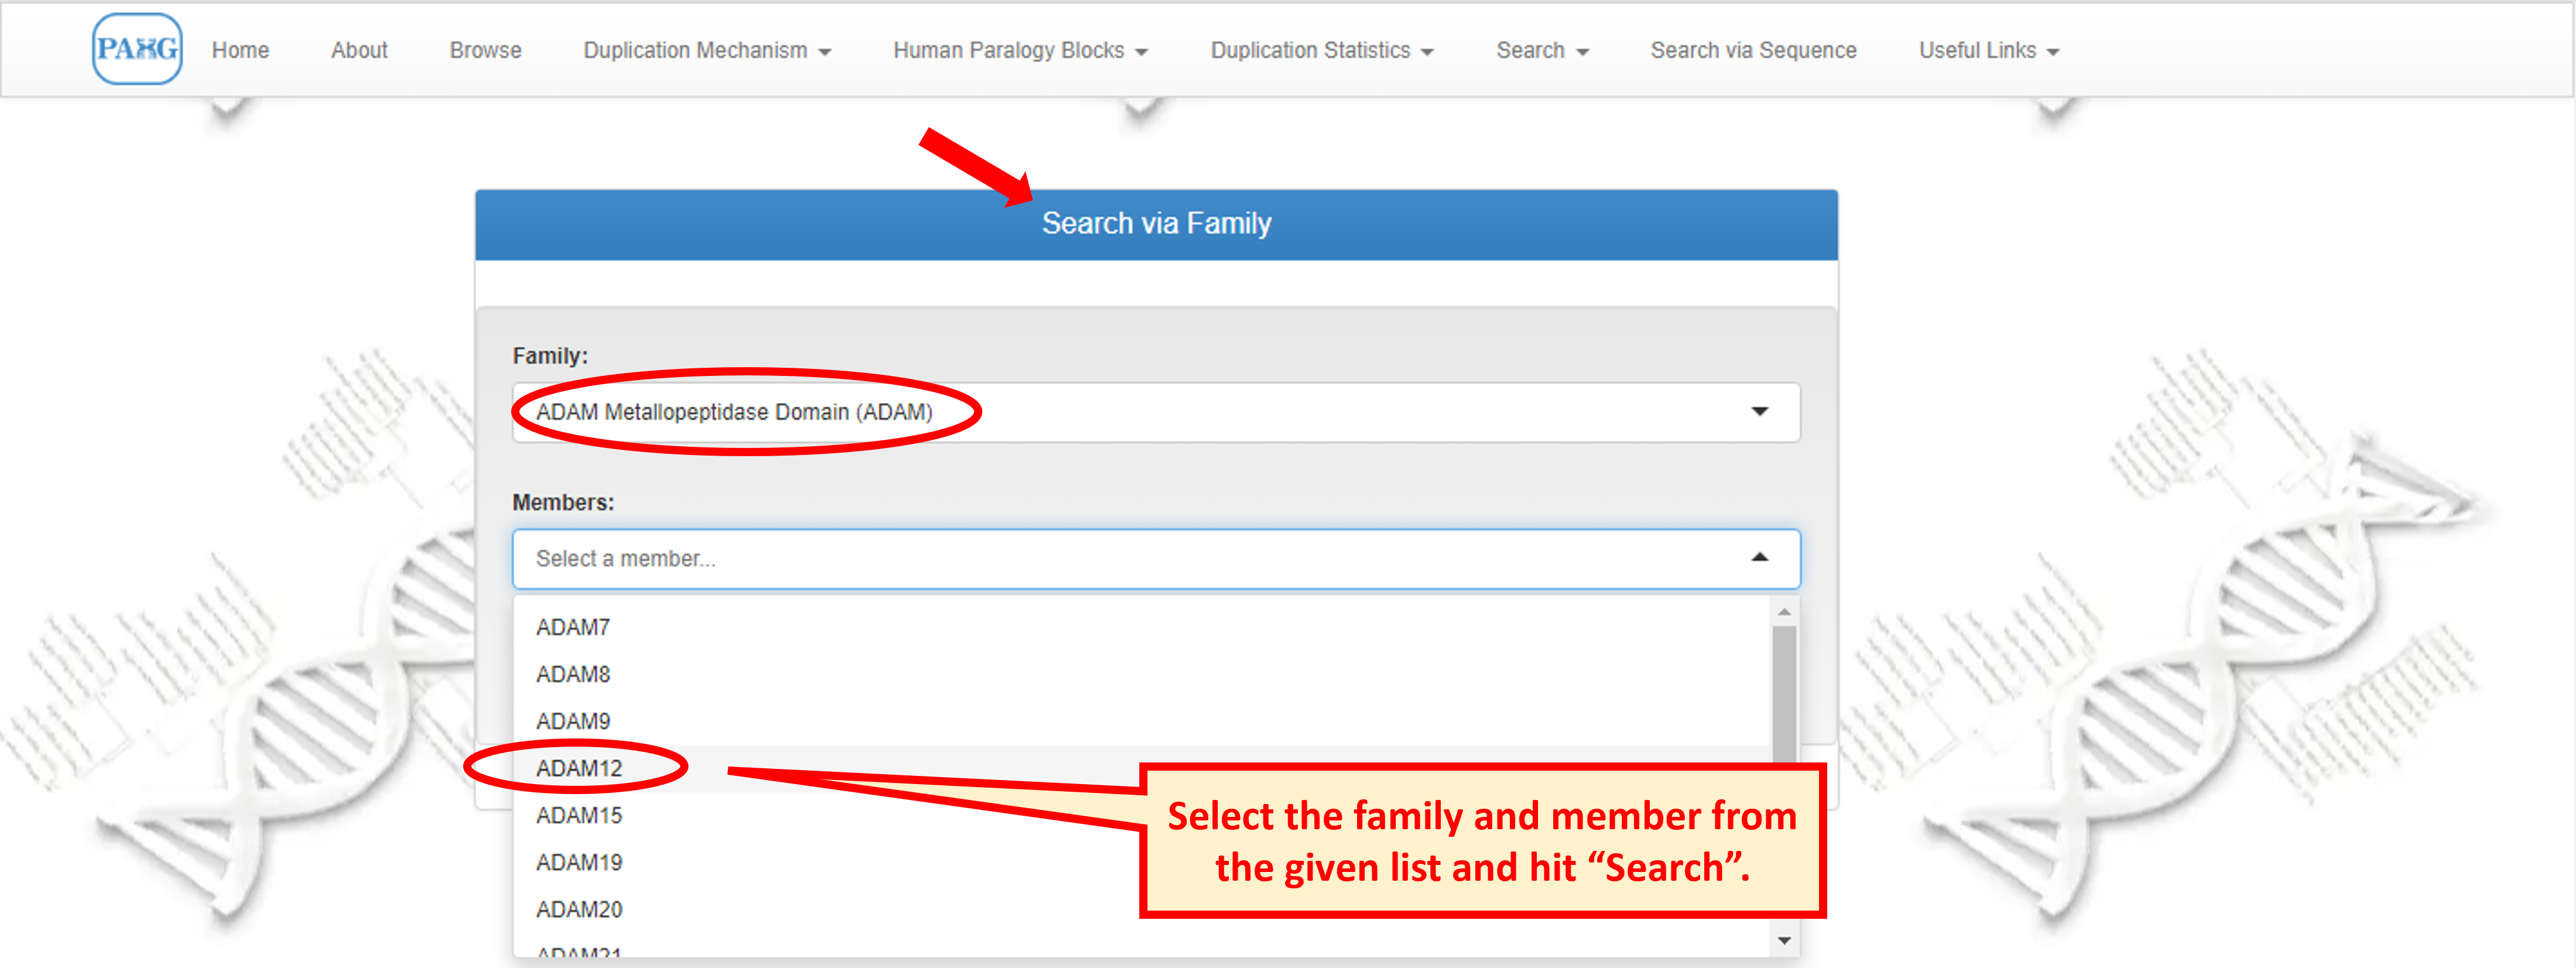
8.1 Search Family
"Search via Family" provides a list of families to choose from. For each family chosen from list, all members of the family appear in the list below, user can either choose the member to view or can leave the member option empty to view family information only.
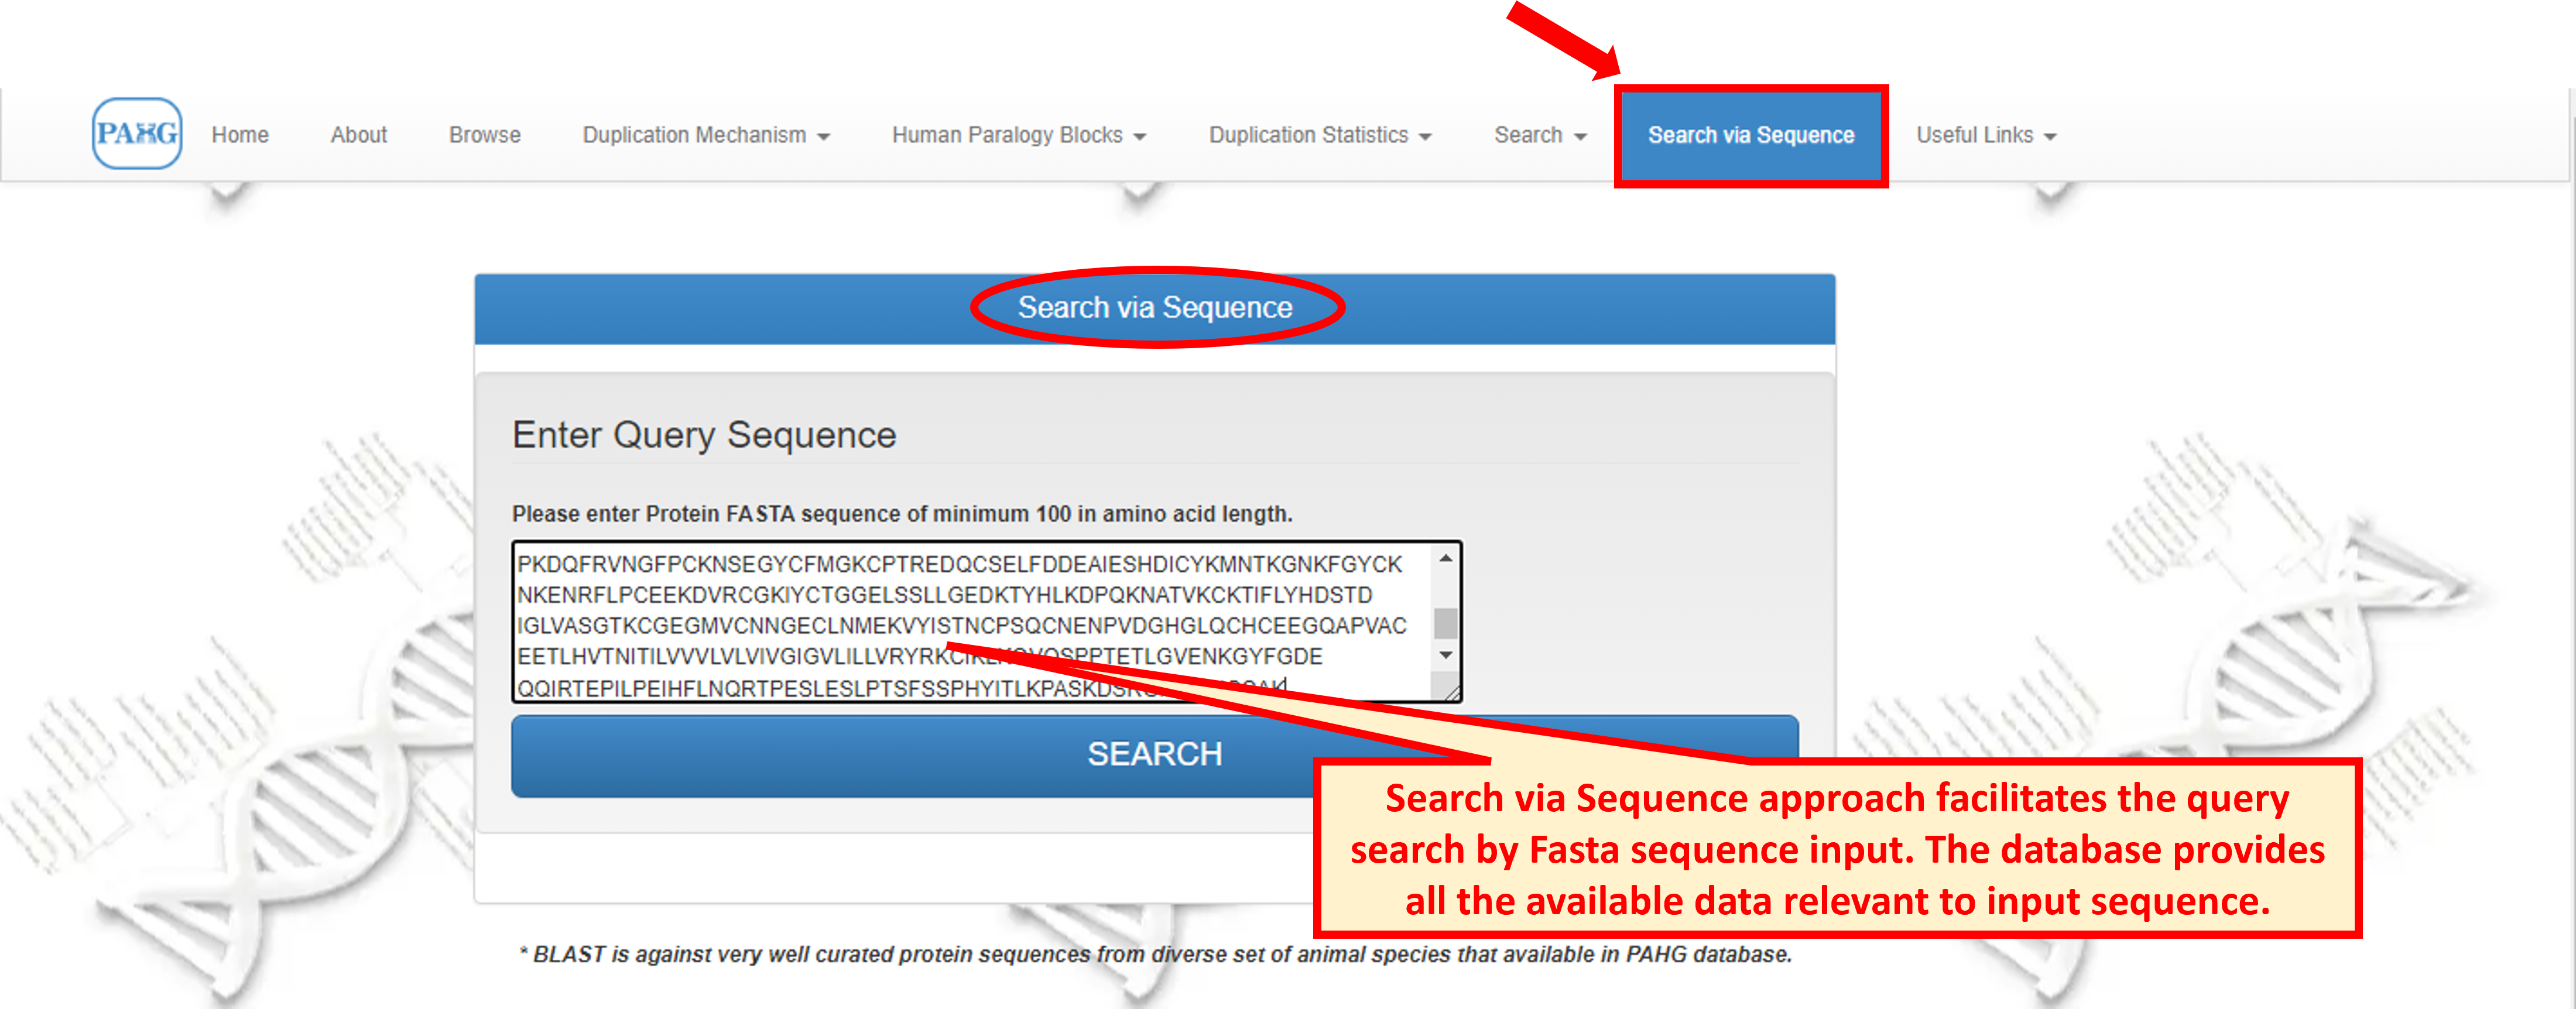
8.2 Search Sequence
While in case of "Search via Sequence", user needs to input the sequence and the member showing the same sequence is displayed.
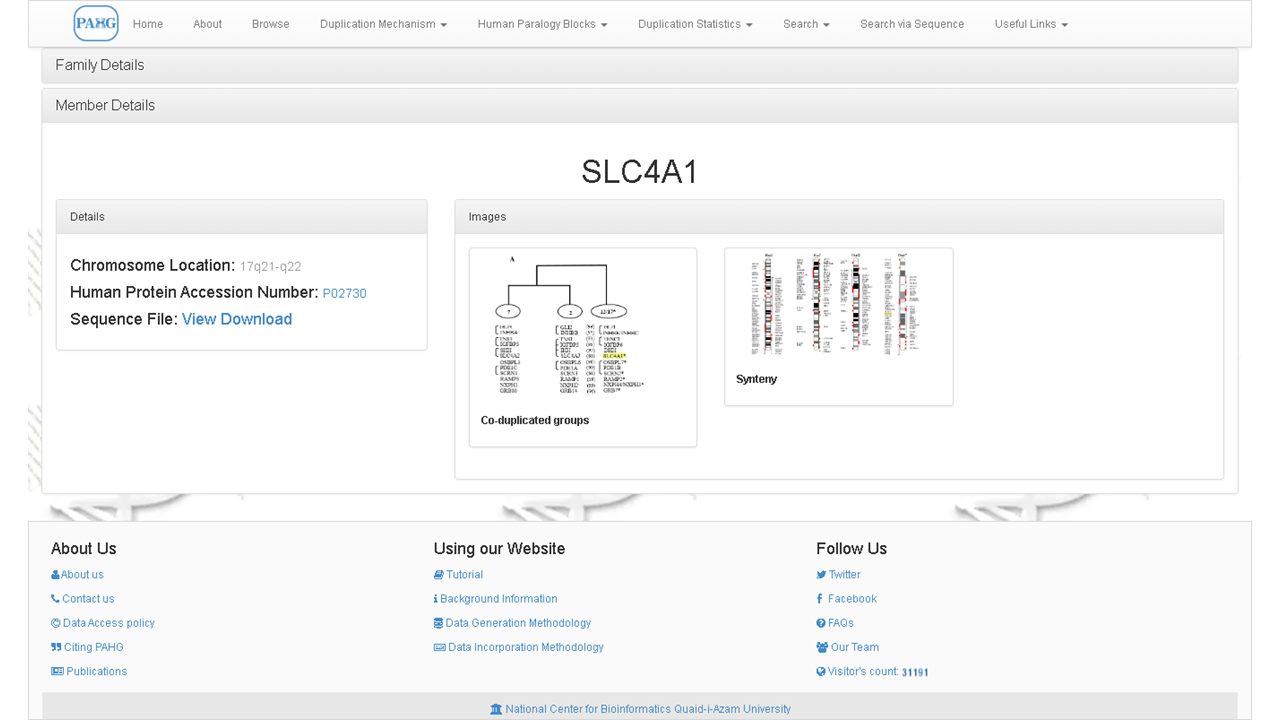
If you select a family and a member both, then the database directs you to the member view explaining its location on chromosome and its pattern of duplication along with sequence information. Graphical images are also provided for the comfort of understanding. these images can be zoomed in to grasp a detailed view of synteny and co-duplication mechanism.
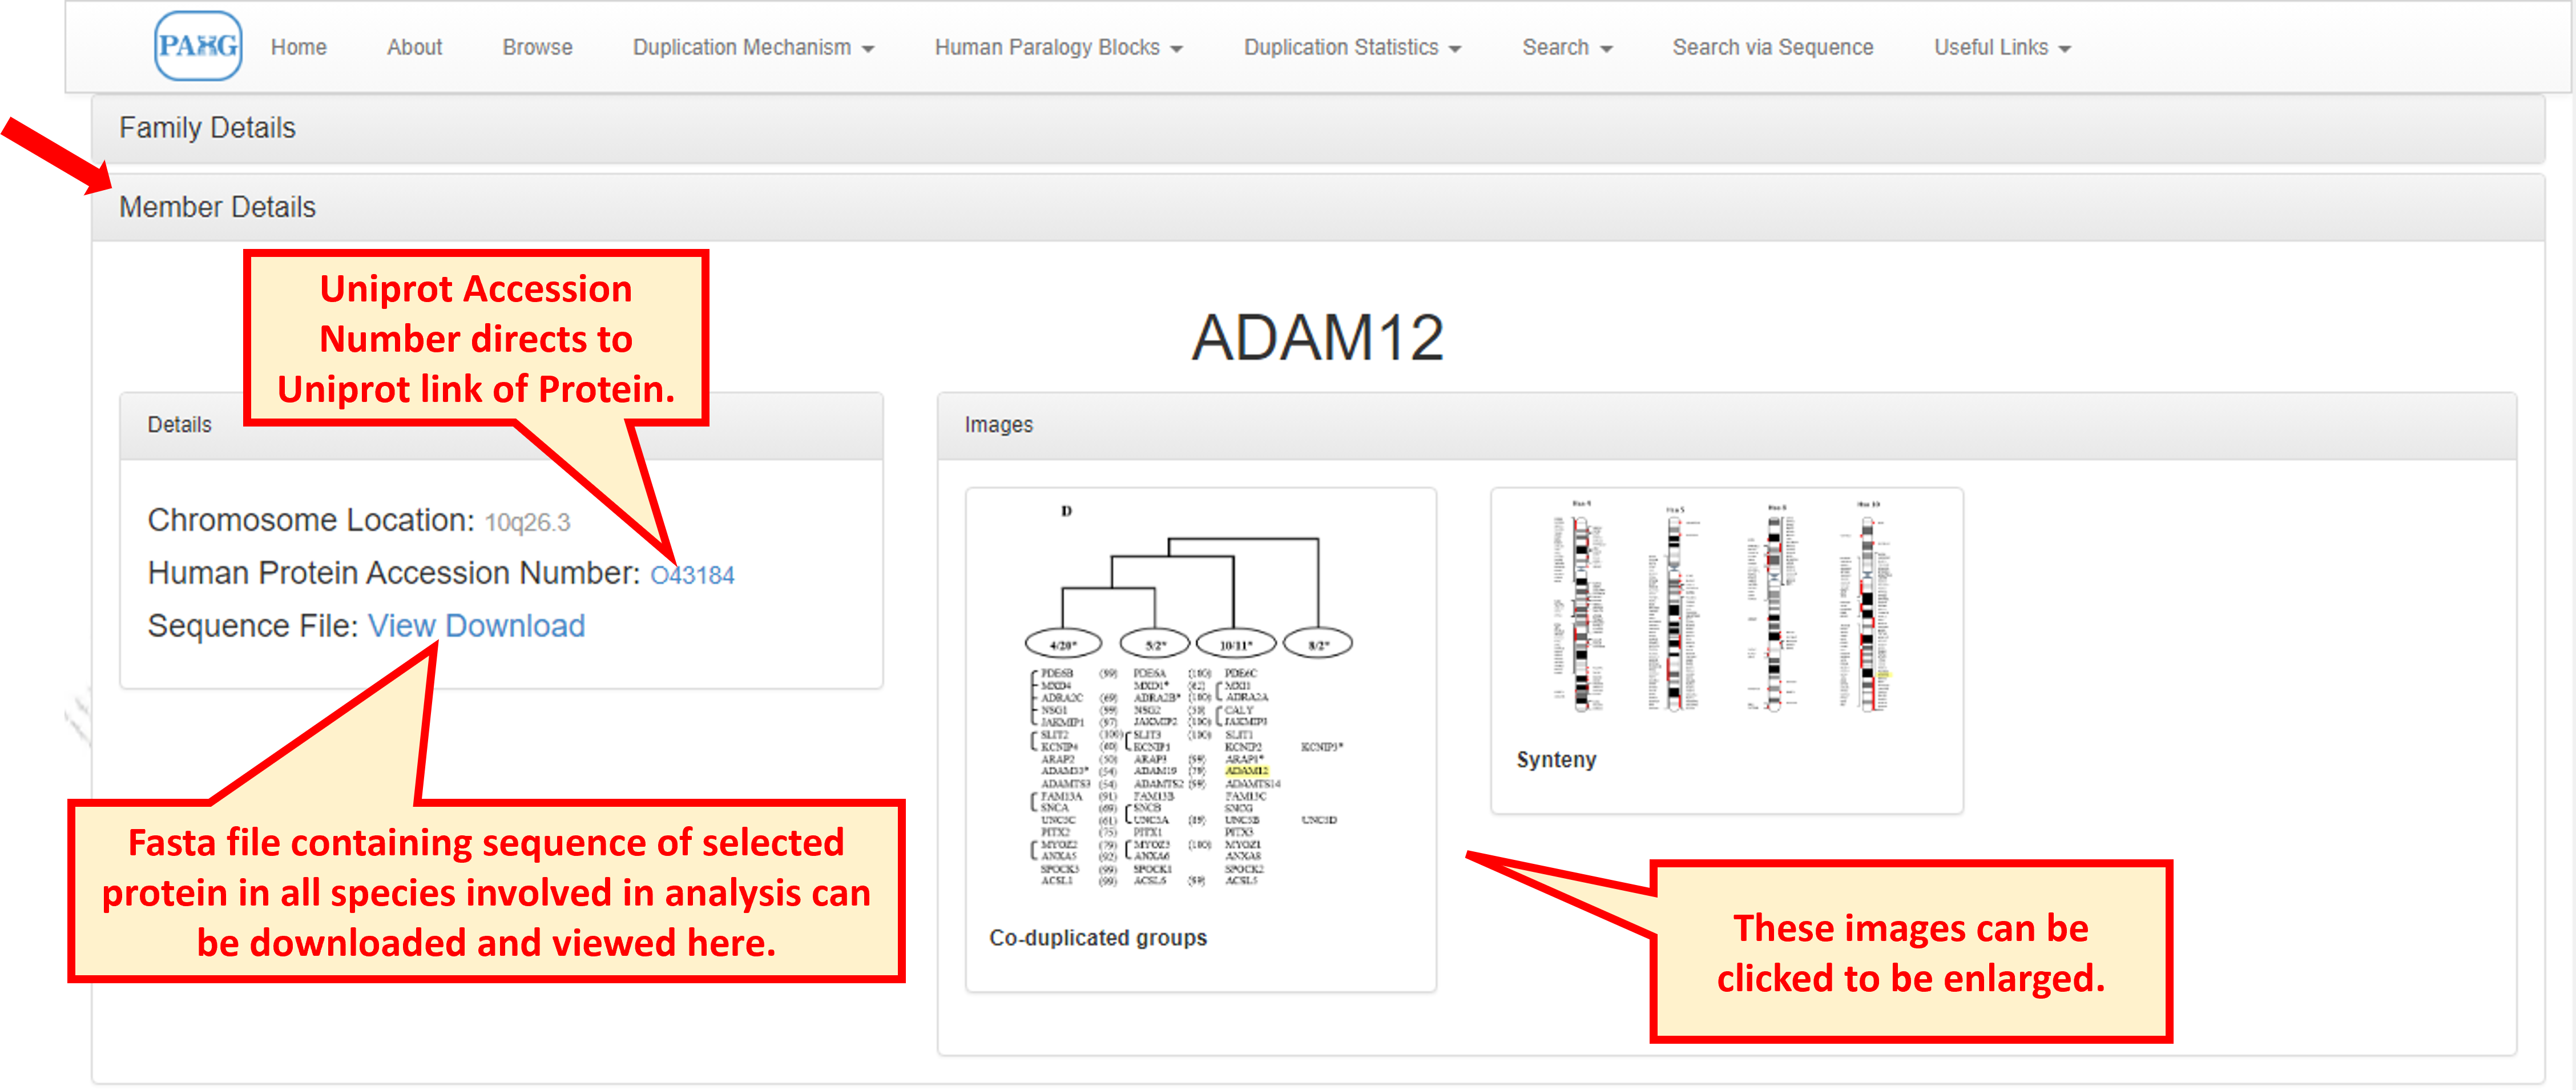
9.1 Co-duplicated Groups
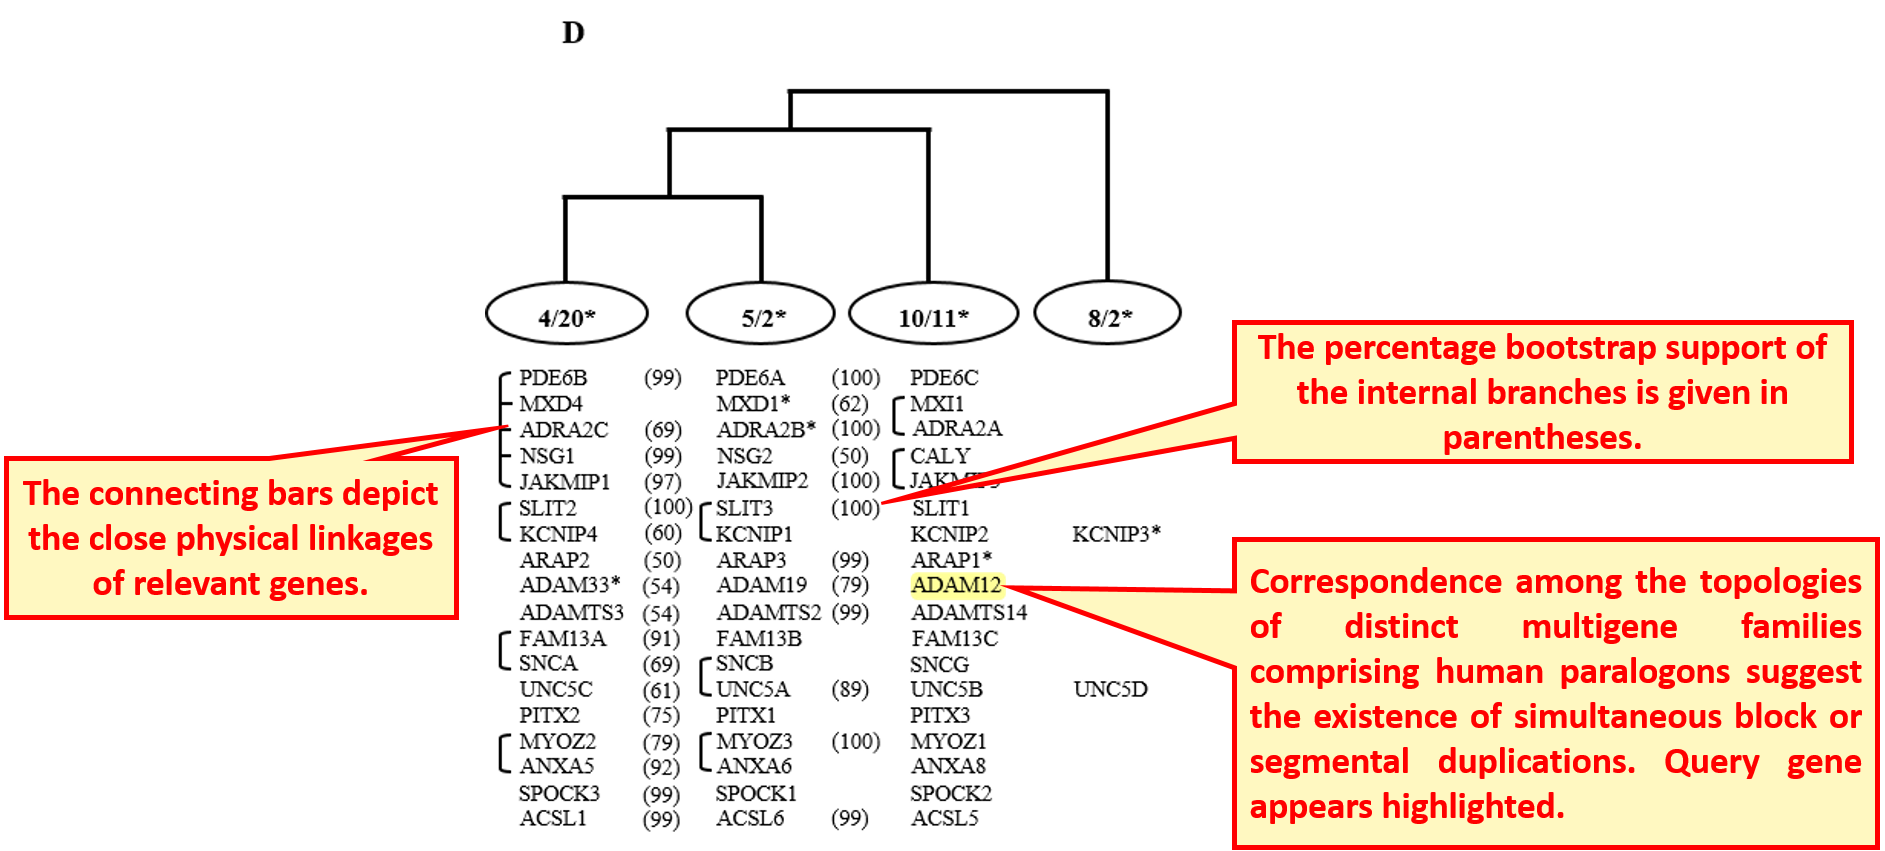
Enlarged view of the figure for co-duplicated groups shows the consistency in topologies of gene family of interest with other families in the paralogon.
9.2 Synteny
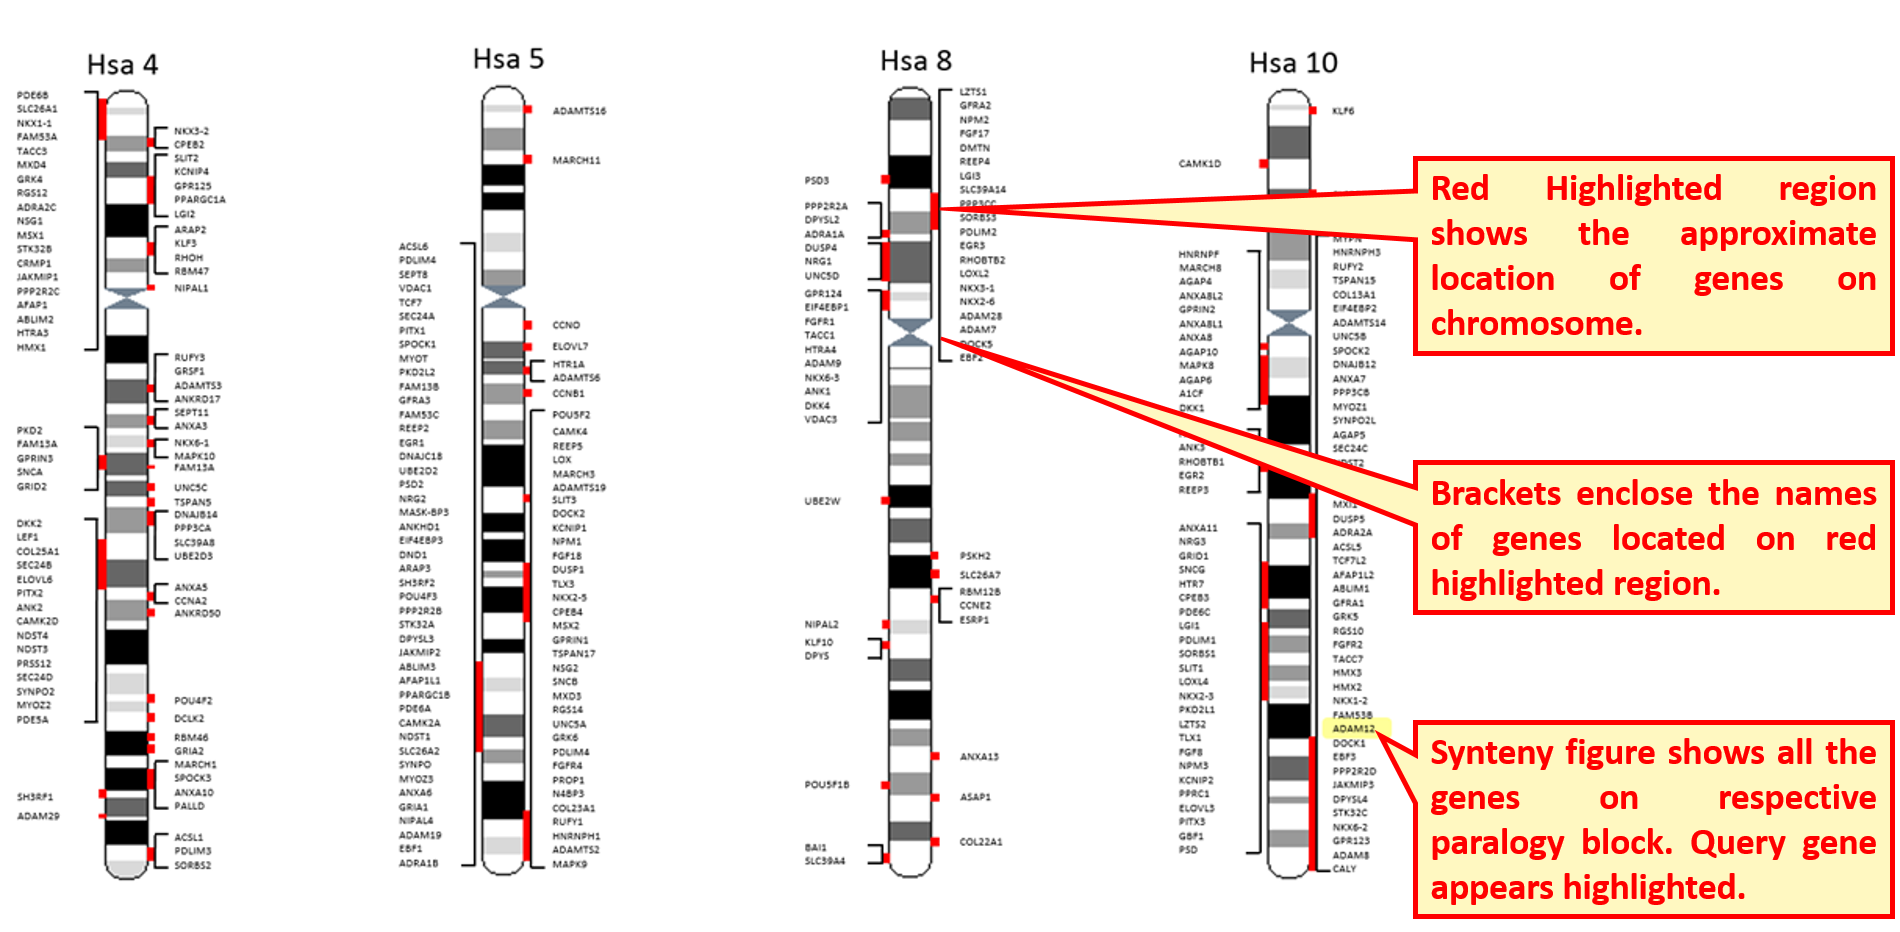
Synteny image shows a larger view of paralogon with duplicated/triplicated/quadruplicated representation of gene families on respective chromosomes. User can view the physical mapping of gene of interest with other members on the paralogon.
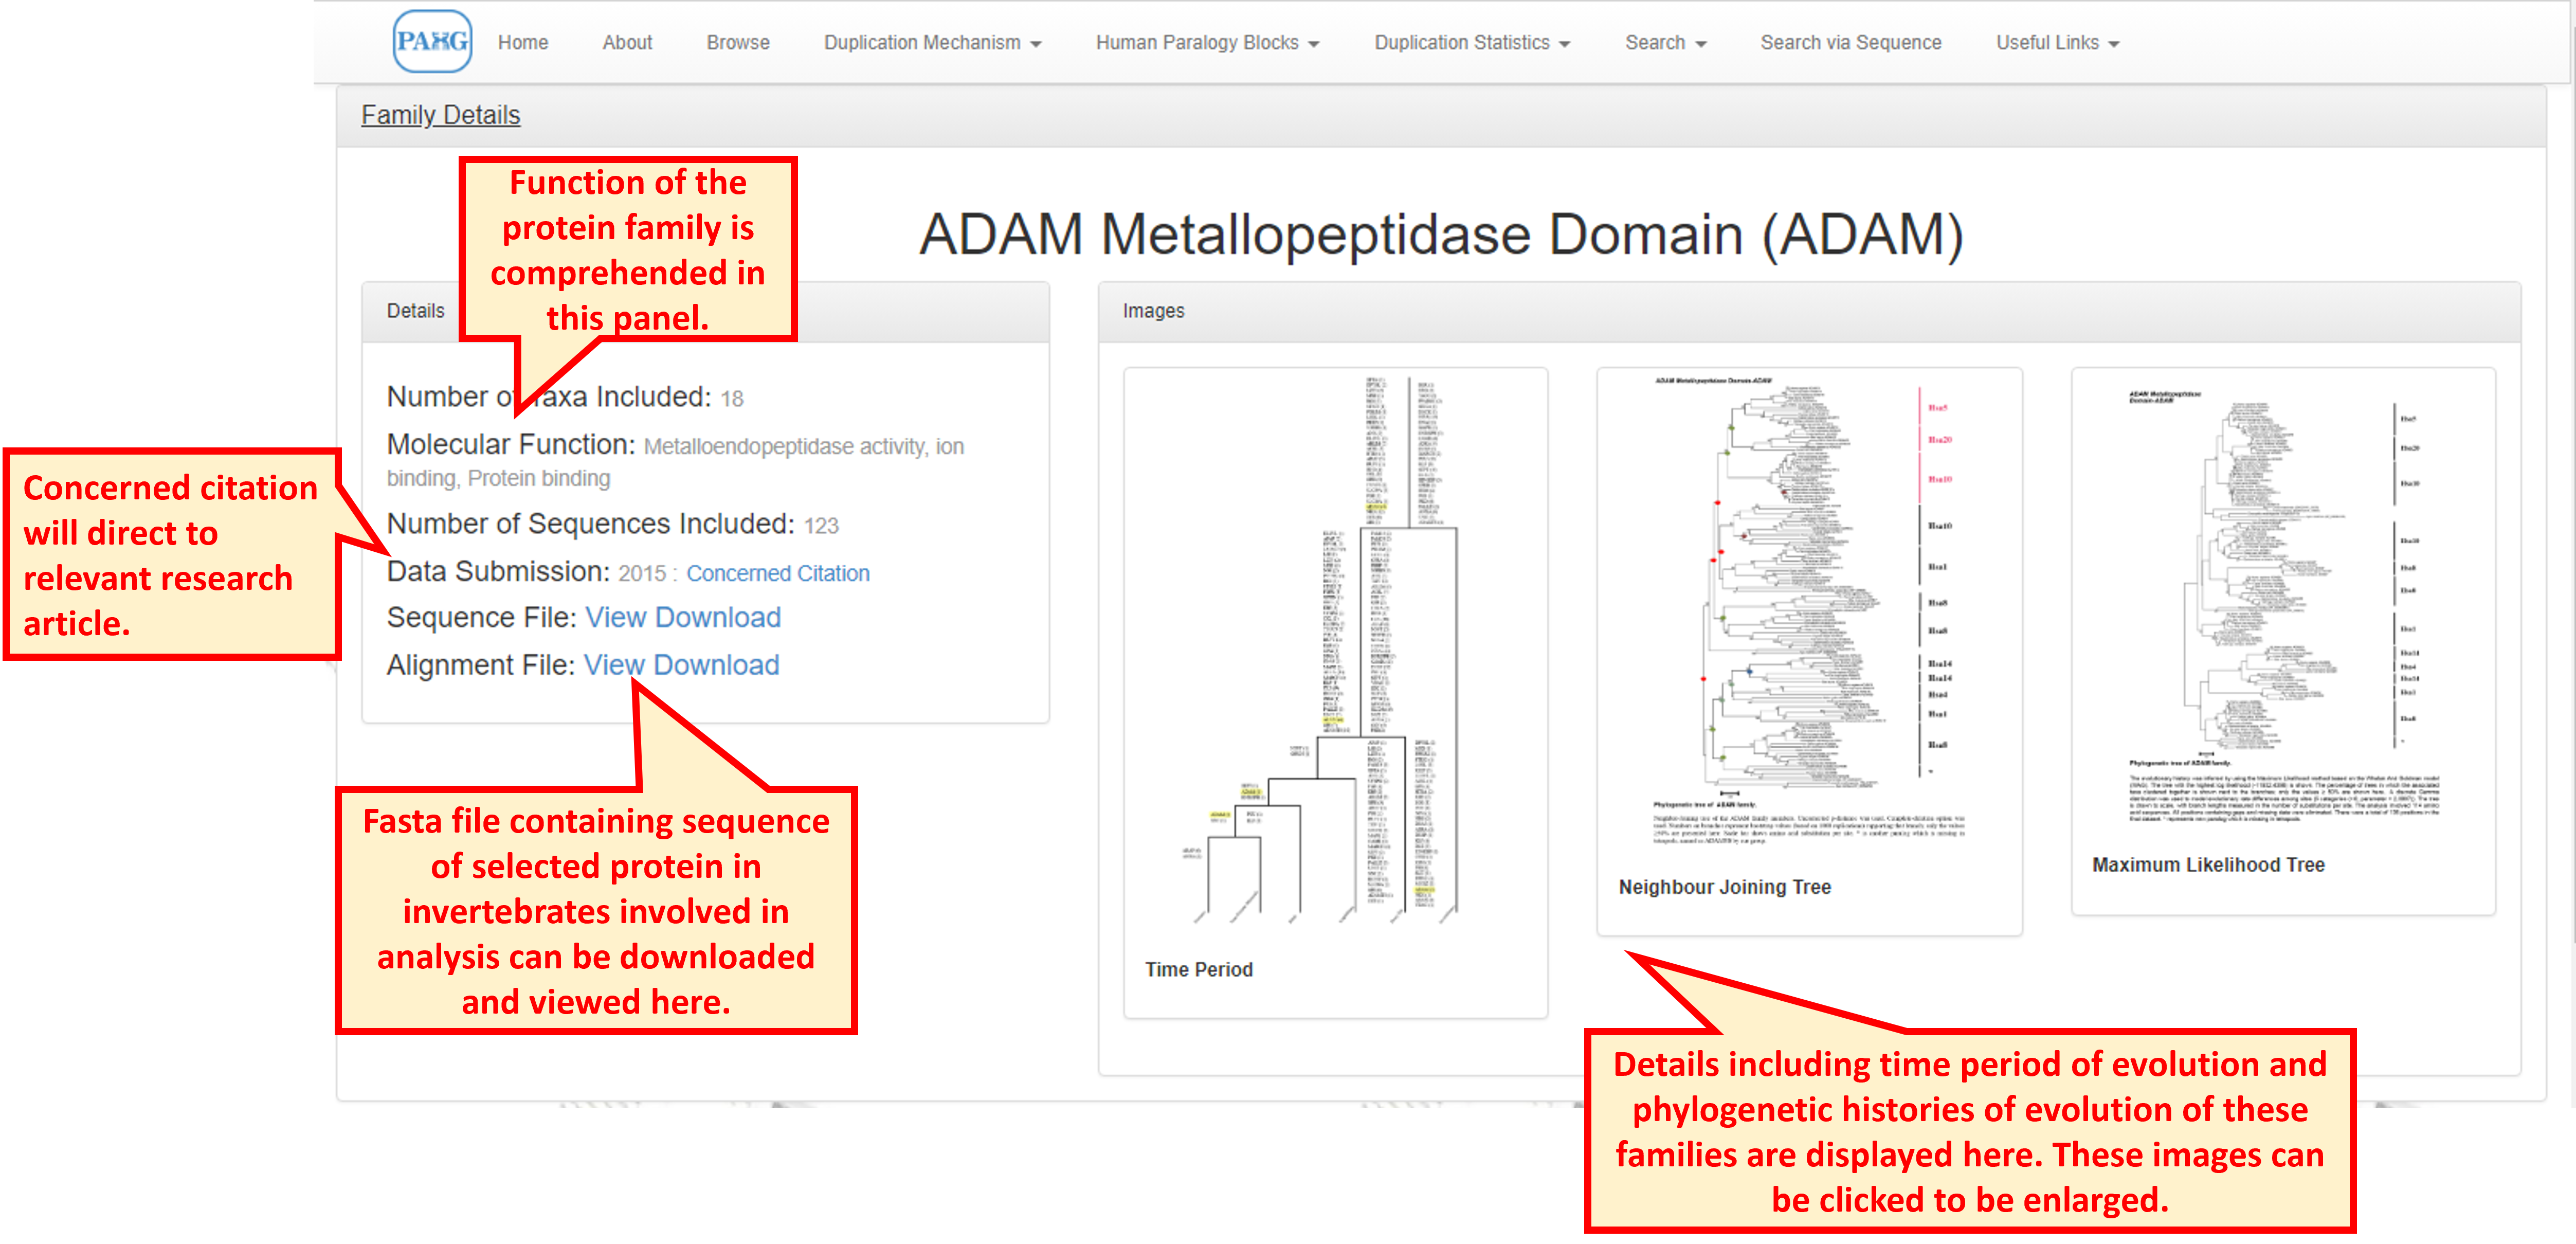
Clicking the "Family Details" opens a broader view of information and provides phylogenetic information in the form of Neighbour-joining and Maximum Likelihood trees. Time period of duplications leading to the evolution of gene family is also given.
10.1 Age estimates of duplication
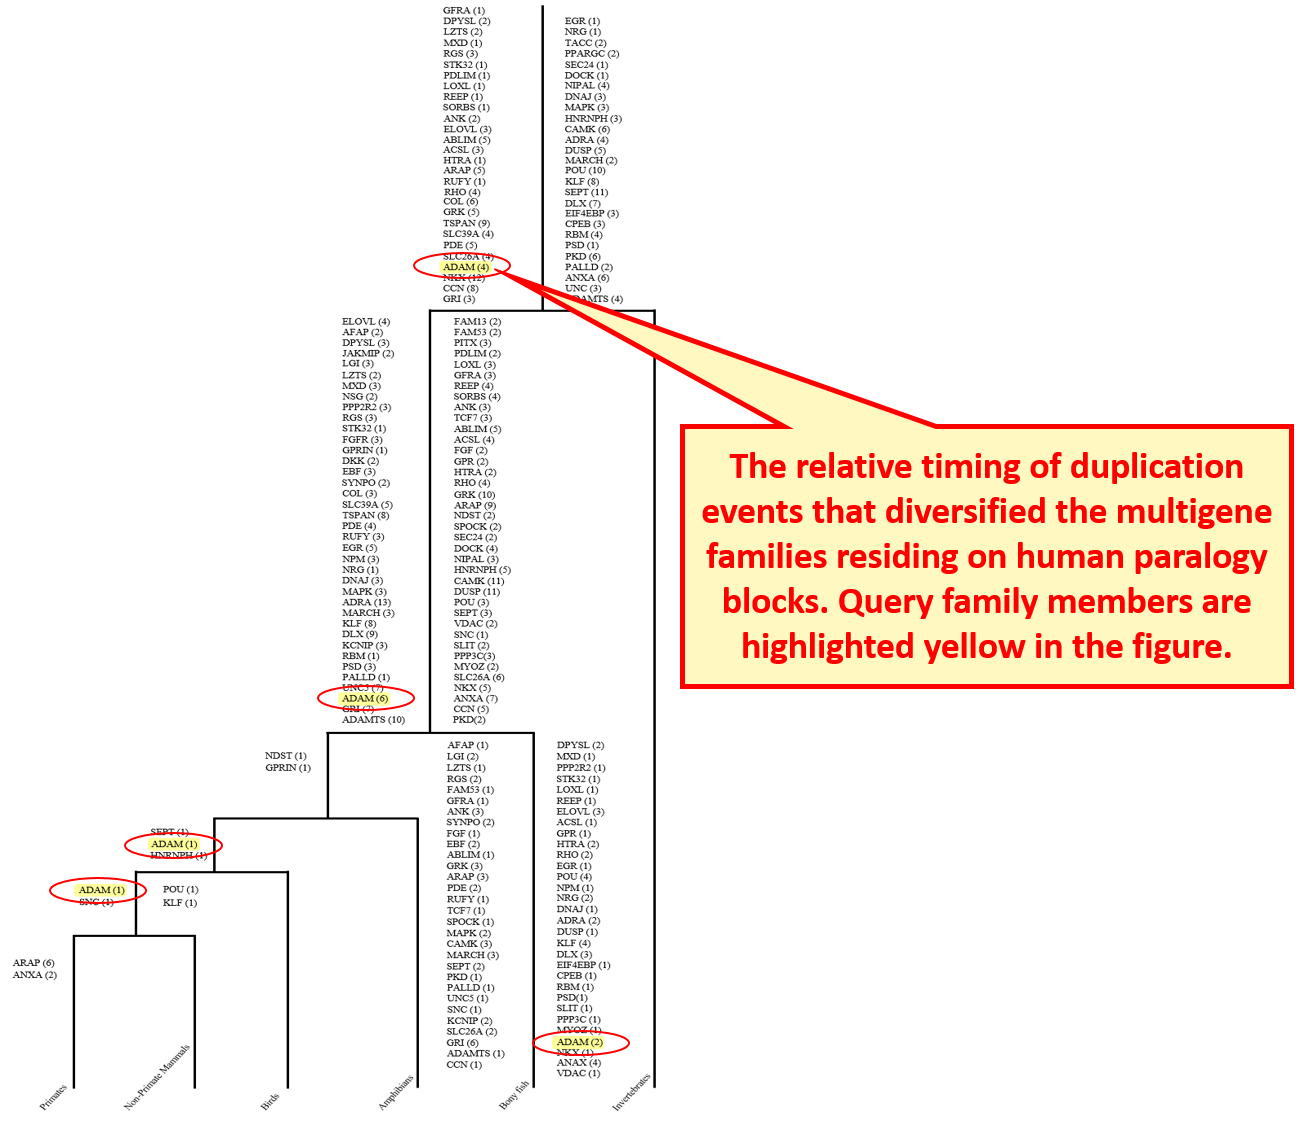
Age estimates of duplication events are explained graphically. Query gene appears highlighted and the number following that gene name indicates the number of duplication events.
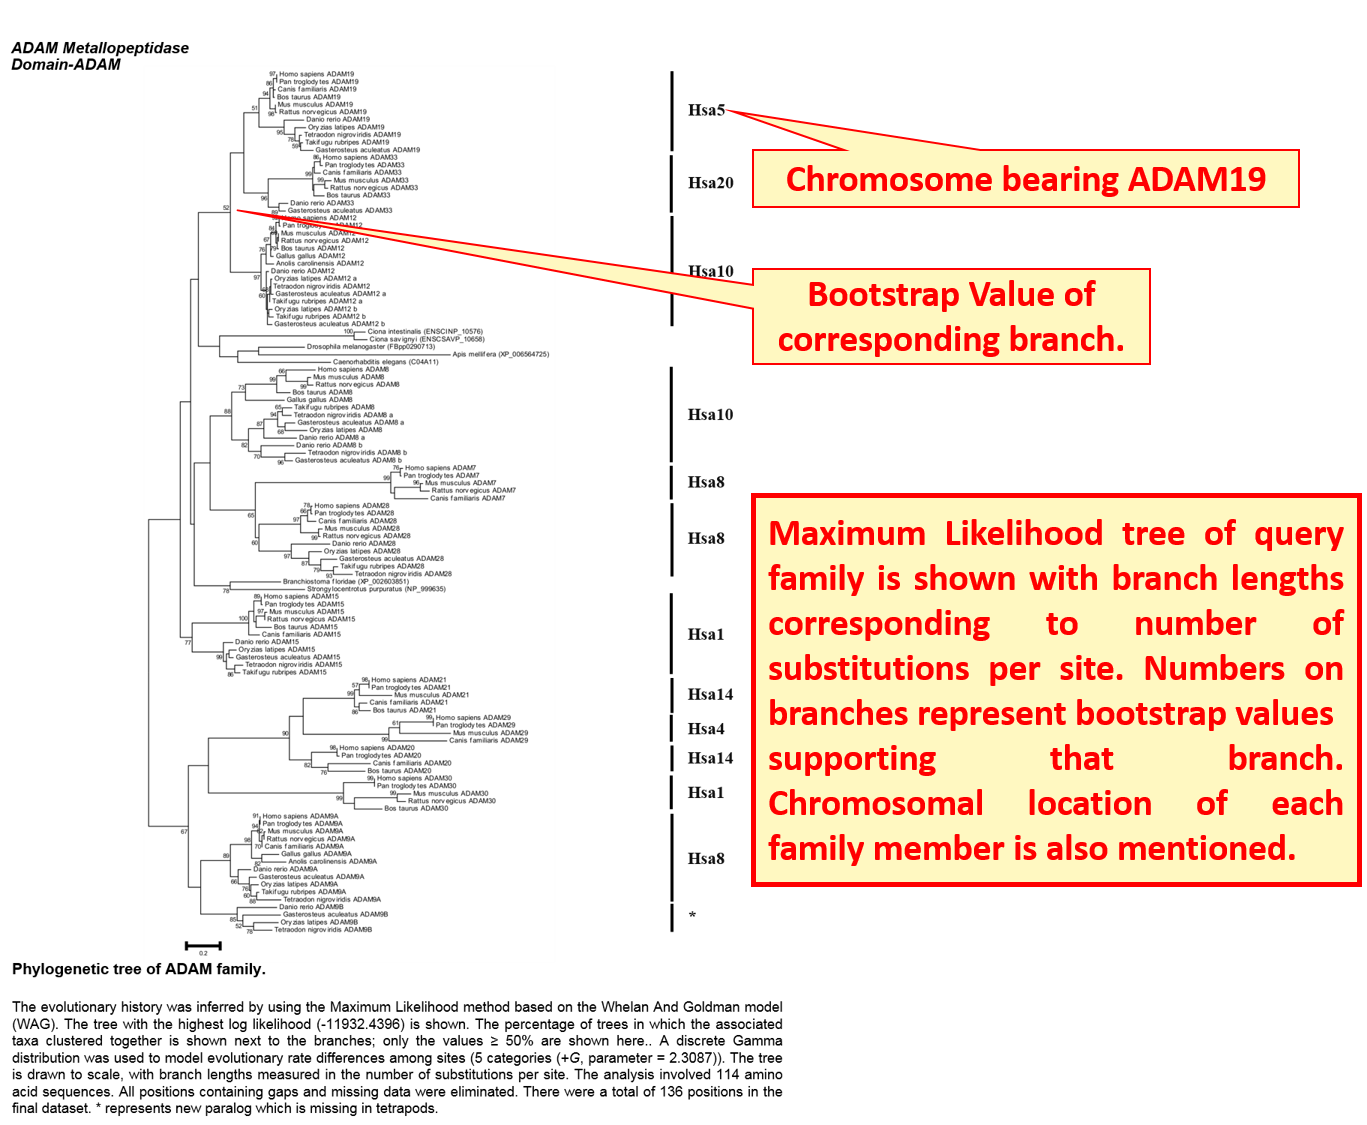
10.2 Phylogenetic History ML Tree
Phylogenetic history of evolution of each family is explained by Neighbor-Joining and Maximum Likelihood trees.
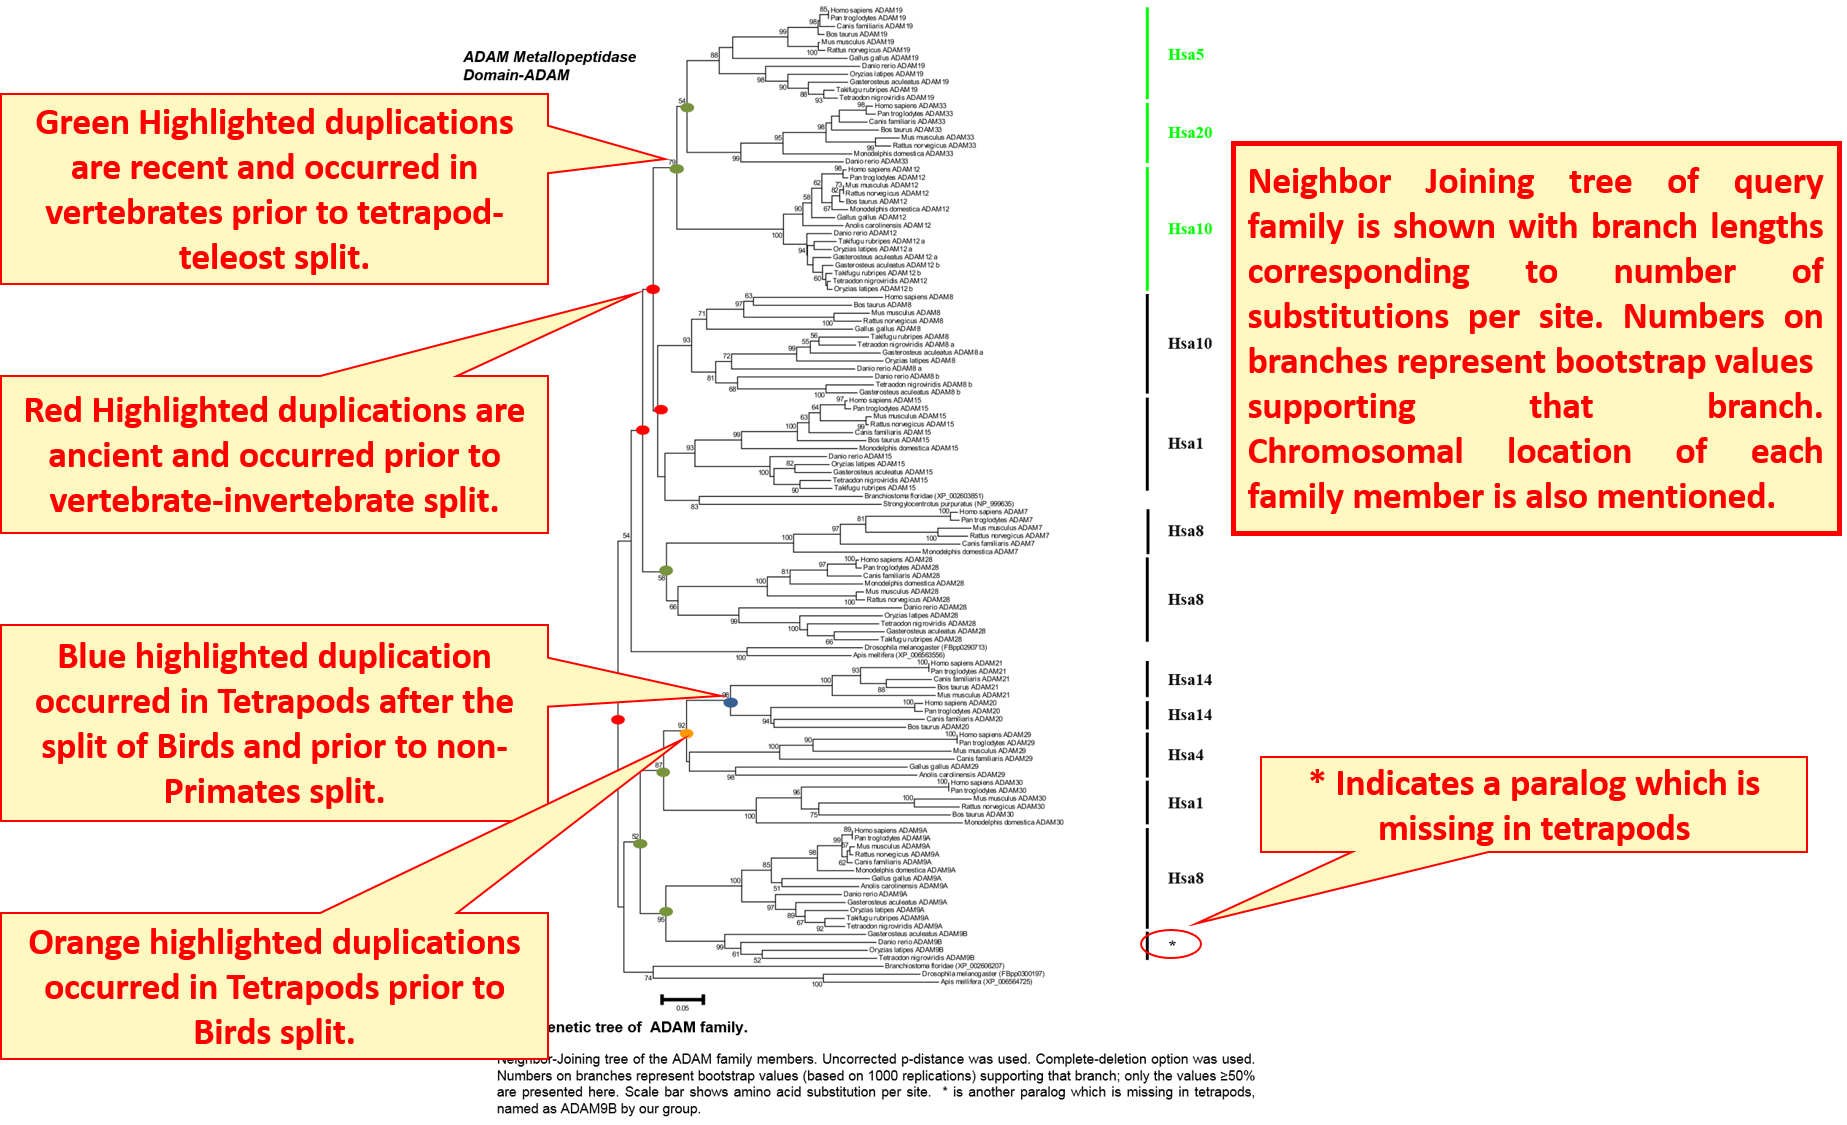
10.3 Phylogenetic History NJ Tree
Neighbor-Joining tree explains the evolutionary history of gene families by highlighting each duplication node. Color codes differentiate ancient and recent duplications.
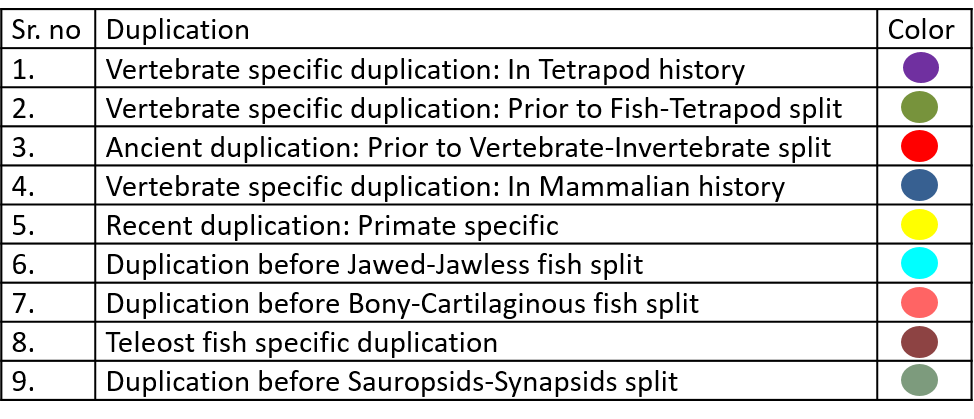
10.3.1 Duplication Nodes
Color codes used to present the time period of duplication nodes in Neighbour-Joining trees are given below.
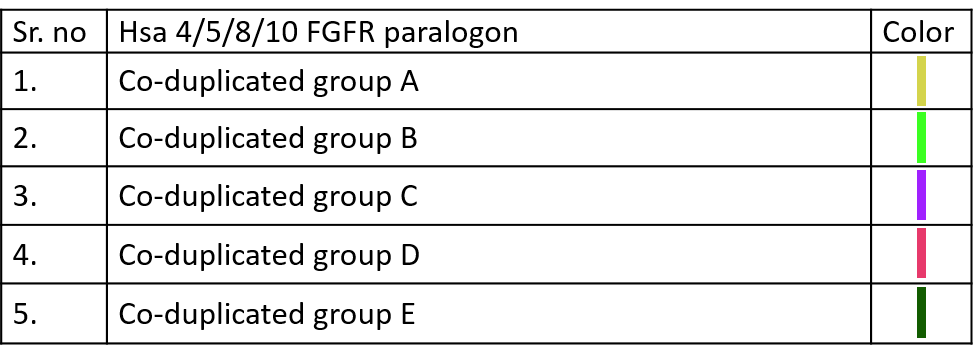
10.3.2 Co-duplication Bands
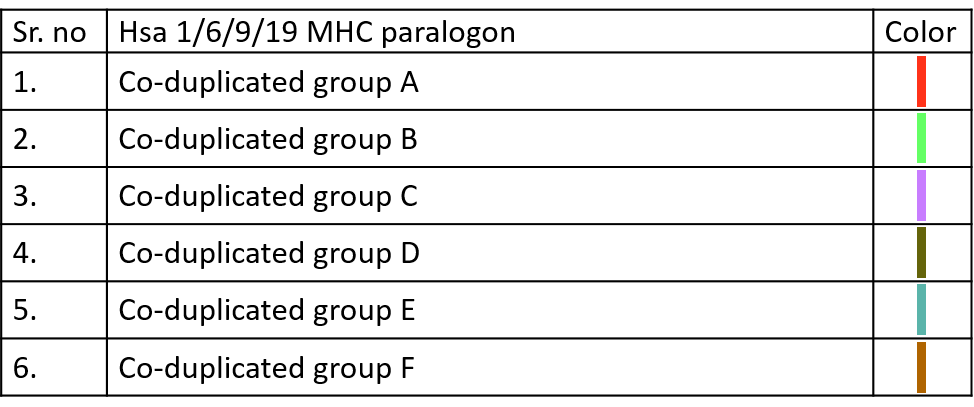
Color codes to identify different Co-duplicated groups of particular paralogon are given below.


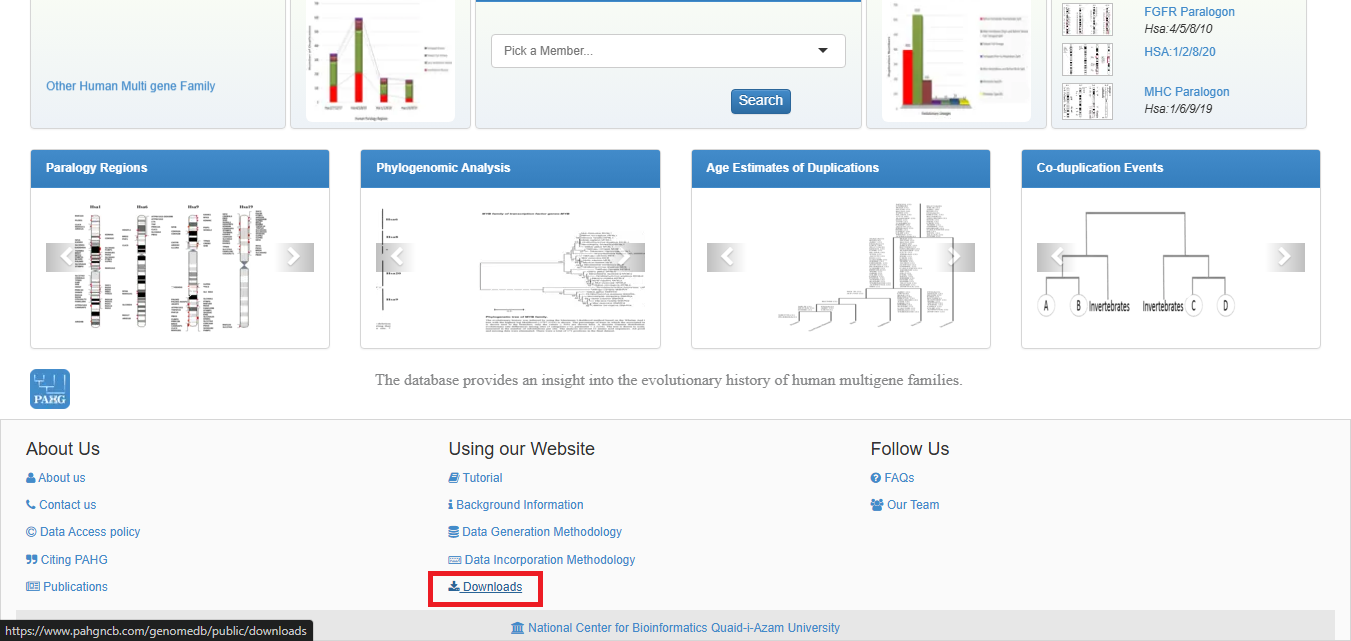
The database allows one-click downloads of various datasets which can be accessed by clicking Download as shown below.
Sequence data for entire gene families or individual gene members, as well as family-wide alignments, are available in FASTA format. Phylogenetic trees for all families can also be downloaded in PDF format.
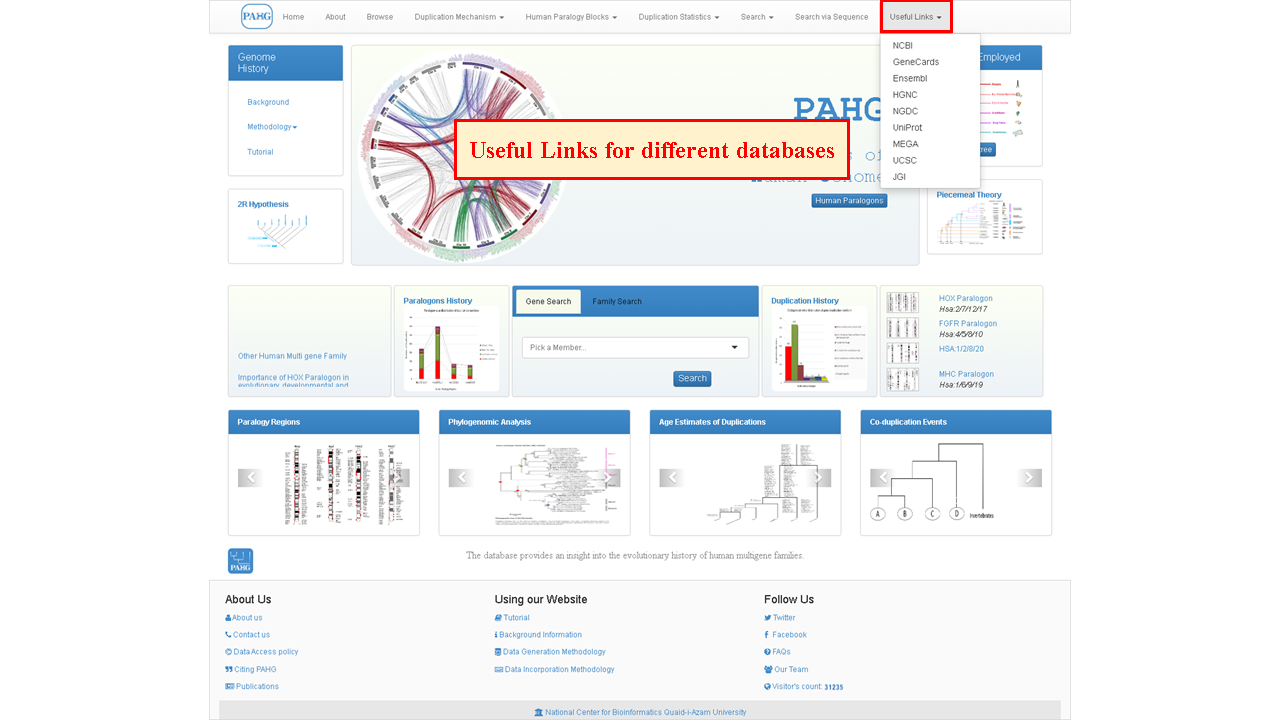
Database links the user to other online sources of information via direct links given in menu.
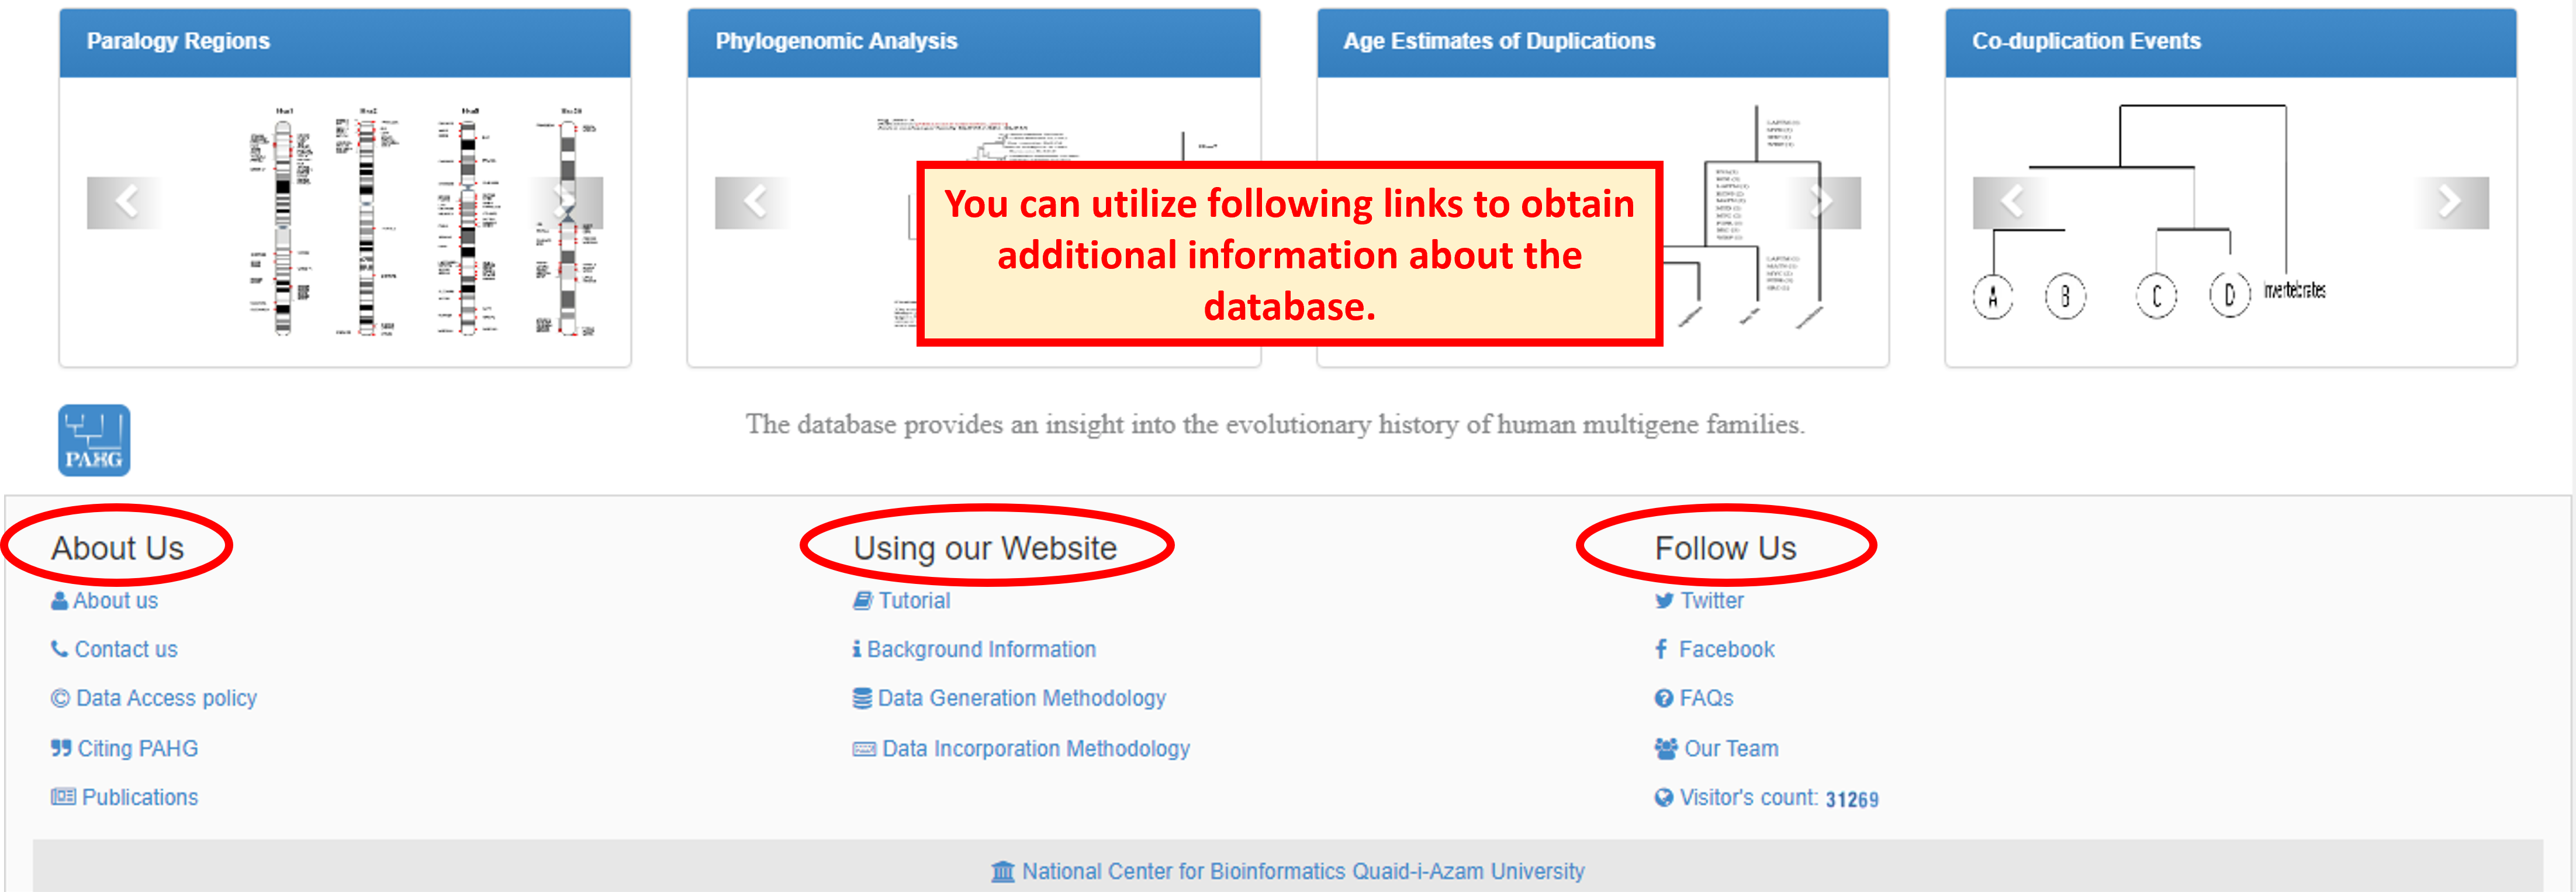
Website footer provides links to information about database, its usage and development. It also lets the user contact the research team for any queries or suggestion.
Contents
2. Global Genome-Wide view
3. About
4. Browse

5. Duplication Mechanisms (Theories)
6. Human Paralogy Blocks
7. Duplication Statistics
8. Search
9. Member Details
10. Family Details
11. Download
