HSA 1/2/8/20 paralogon phylogenomic analysis
The absolute nature of evolutionary events that had led to creation of ancient paralogy regions in the vertebrate genome is extremely difficult to track through inter-genomic and intra-genomic map comparison approaches because such ancient events experienced multiple chromosomal breakages and rearrangements that led to the alteration of karyotype and disruption of gene order on chromosomes. A more convincing way to determine the mechanism of origin of vertebrate ancient paralogons is phylogenetic analysis of multigene families (Abbasi, 2010; Abbasi and Grzeschik, 2007; Asrar et al., 2013; Hughes, 1998; Hughes et al., 2001a). This approach effectively apprehends the precise nature of anciently duplicated genomic regions in two ways: Firstly, by estimating relative timing of duplication events occurring prior or after a speciation event. This type of relative dating can provide a robust picture of extent of duplication events within particular time window (Van de Peer, 2004). Secondly, the evolutionary origin of paralogons can be examined by coupling the information from the global physical organization of gene families comprising of paralogons with their relevant tree topologies.
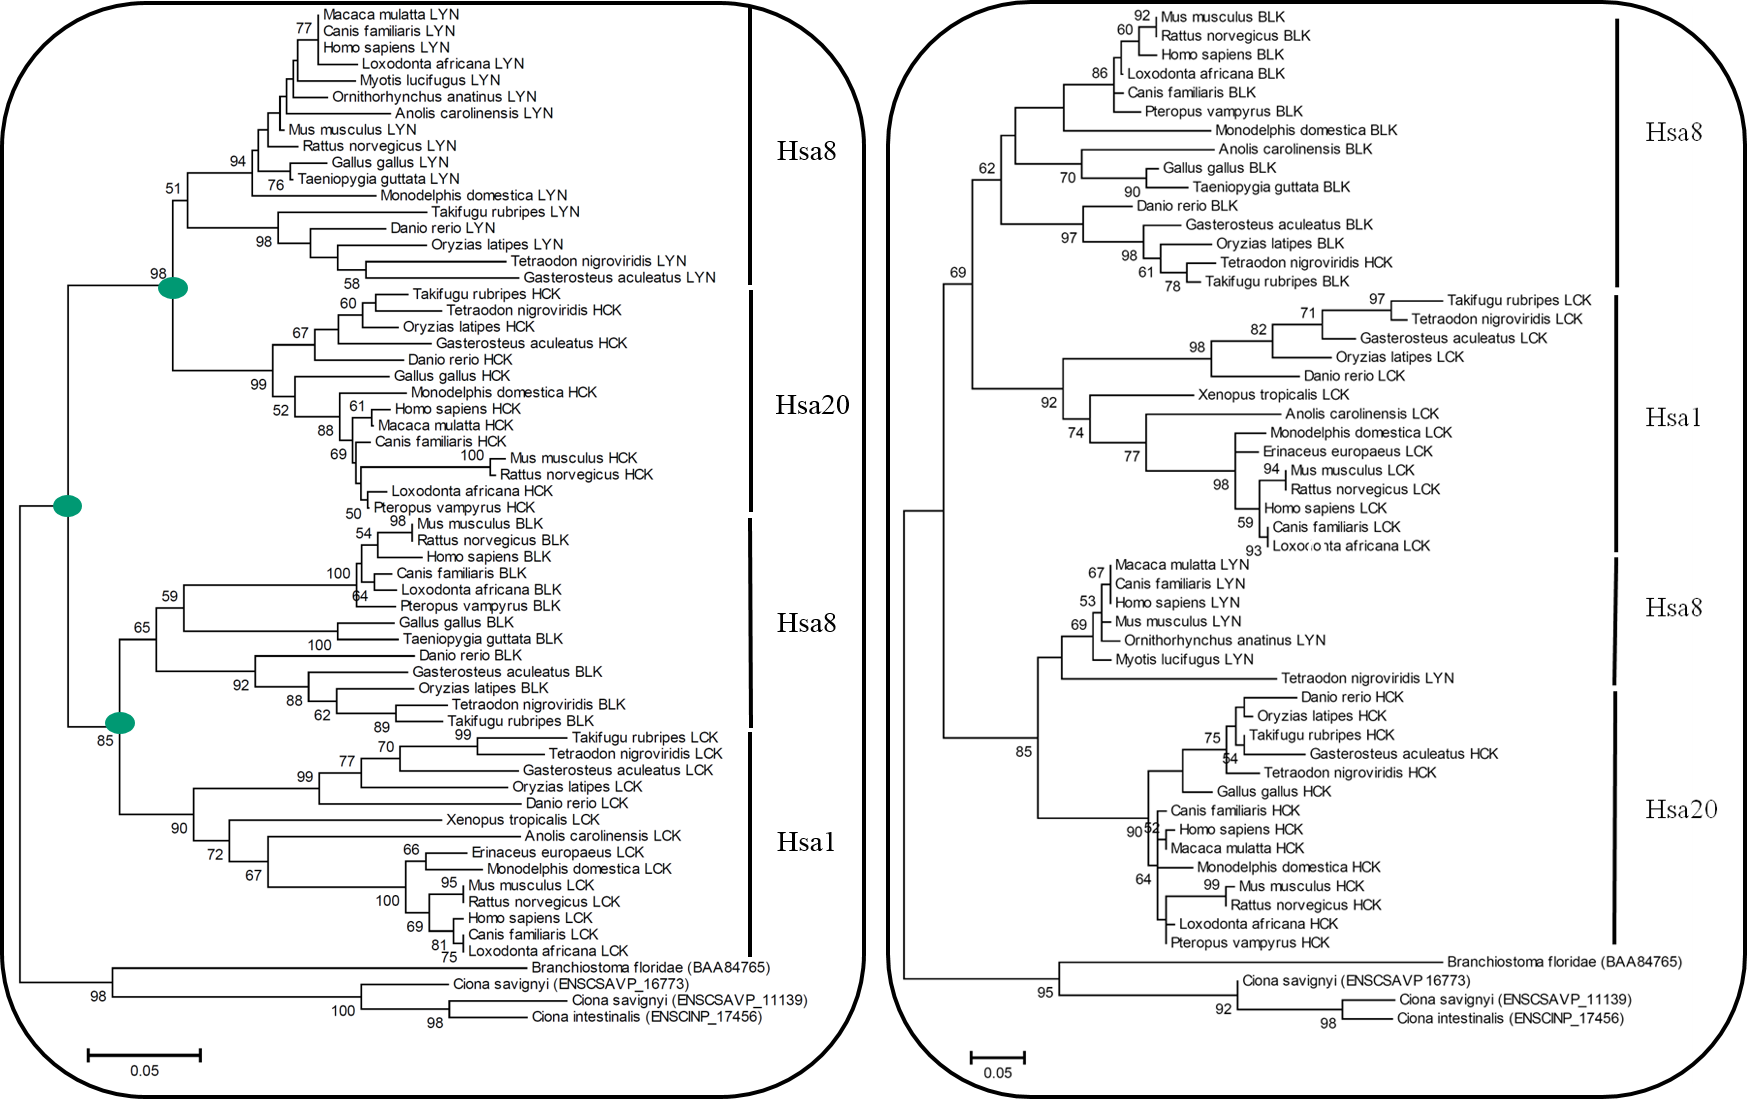
In order to test the assumptions of the tetralogy hypothesis, genes with three fold or four fold representation in the proposed paralogy regions on human chromosomes 1(p36– p34)/9q34, 2p24/6(q21–q23)/8p13, 8(q12–q24)/18p11 and 20 (q11–q13) were identified by scanning the human genome sequence maps available at the Ensembl and UCSC genome browsers (Flicek et al., 2011; Fujita et al., 2011). A total of 11 families were identified: seven with fourfold representation and four with threefold representation in these paralogy blocks. The closest putative orthologs of the human proteins in other species were obtained using BLASTP in the Ensembl genome browser (Altschul et al., 1990). To enrich these gene families with sequences from those organisms for which sequence information was not available at Ensembl, a BLASTP search was carried out against the protein database available at the National Center for Biotechnology Information (Johnson et al., 2008) and the Joint Genome Institute [http://www.jgi.doe.gov/]. The phylogenetic tree for each gene family was reconstructed using the neighbor-joining (NJ) method (Russo et al., 1996; Saitou and Nei, 1987). The complete deletion option was used to exclude any site that postulated a gap in the sequences. Uncorrected proportion (p) of amino acid differences were used as amino acid substitution models. The reliability of the resulting tree topology was tested by the bootstrap method (1000 pseudoreplicates), which generated the bootstrap probability for each interior branch in the tree (Felsenstein,1985). For each gene family, a maximum likelihood tree was constructed using the Whelan and Goldman (WAG) model of amino acid replacement (Whelan and Goldman, 2001).

Figure 1(a): Neighbor Joining (N.J) Tree of HCK Family Figure 1(b): Maximum Likelihood (M.L) Tree of HCK Family
References: